

Read your survey results
Find the results of a survey in the Analyze pages, from the overall rates to each answer, and read them without misjudging the numbers.
Once a survey collects responses, its results live in the Analyze pages: overall rates first, then each question and each answer.
Before you start
Section titled “Before you start”- The survey has been live for a while and has responses. To set it live, see Choose who sees your survey.
- Replays shows only when your plan includes Session Replay. Content analysis shows only when AI features are on for your workspace; without a plan that includes it, it carries an upgrade icon.
Open the results
Section titled “Open the results”- Open the survey and click Analyze in the header. The Survey analytics page opens.
- Pick the period in the date picker at the top. Every page of the side menu uses it.
- To narrow the results to some users or answers, add filters: see Filter survey responses. The period and the filters follow you from page to page.
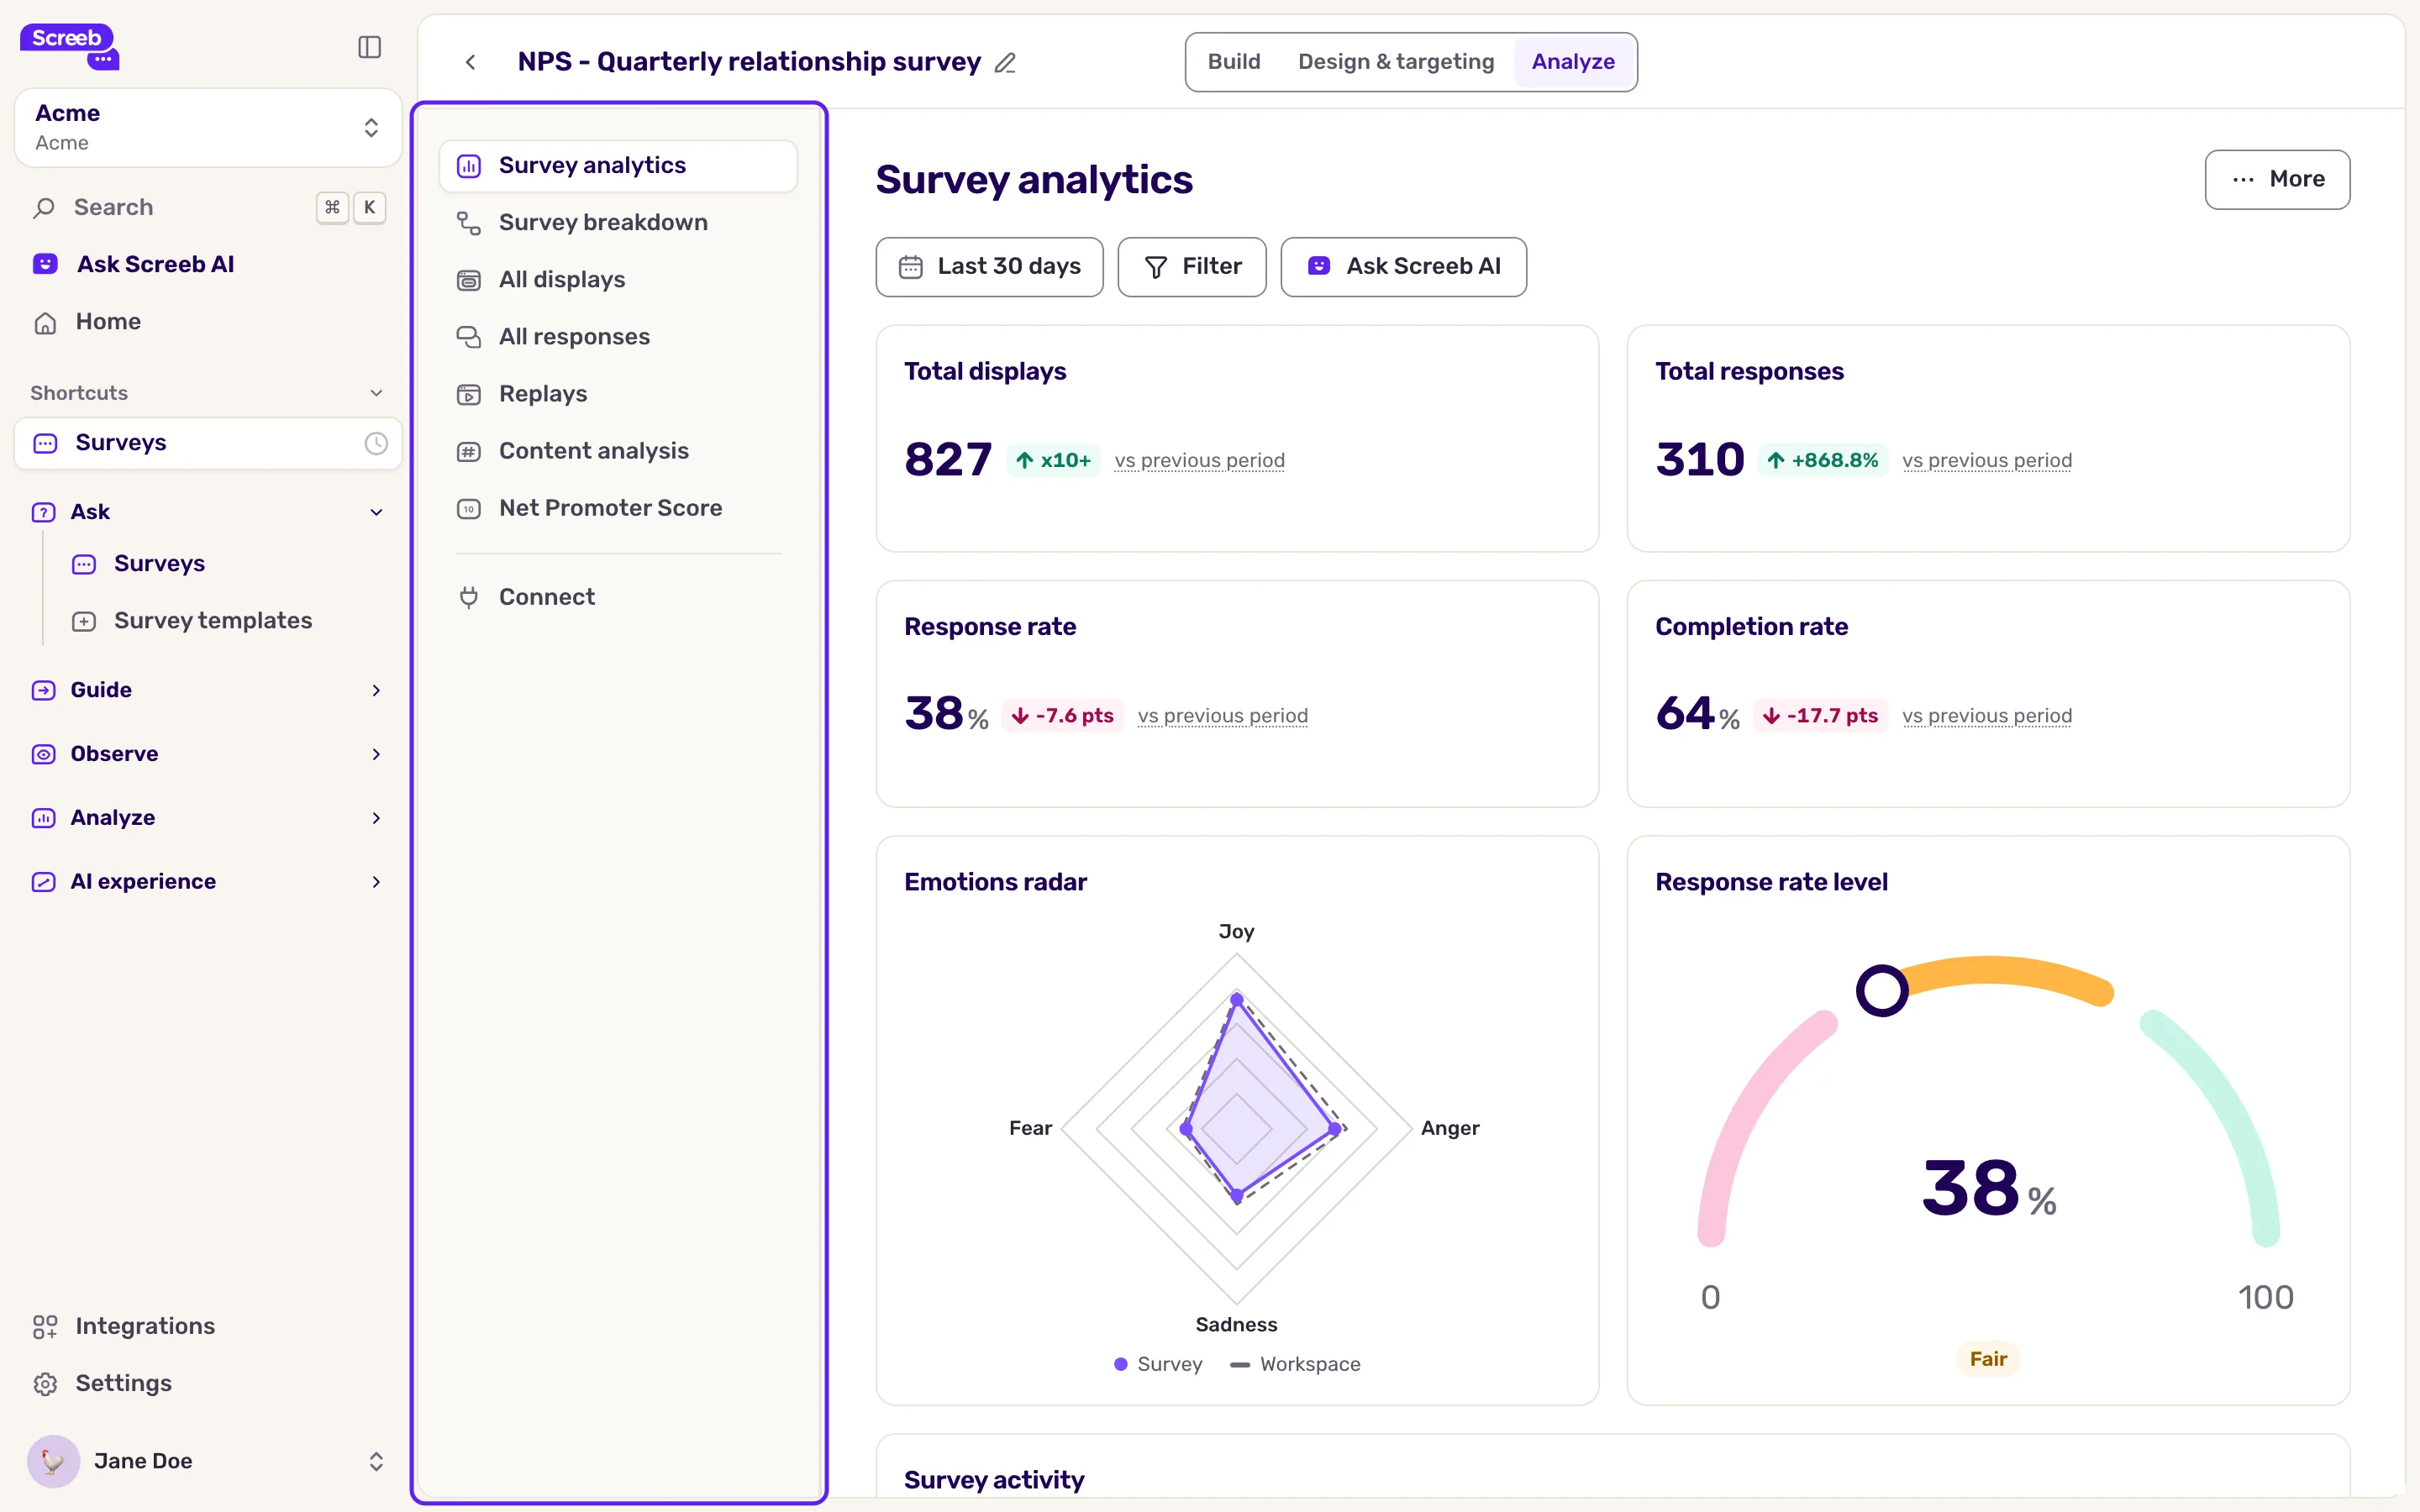
The Analyze pages
Section titled “The Analyze pages”| Page | What it shows |
|---|---|
| Survey analytics | The overview: displays, responses, response rate, completion rate, emotions, displays and responses over time, main topics. |
| Survey breakdown | How many displays reach each step of the survey, to spot where users stop. See Follow respondents step by step. |
| All displays | Every display, question by question, including the ones nobody answered. |
| All responses | The answers, question by question, with a chart and the list of responses, audio and video answers included (see Ask questions in video and collect audio or video answers). |
| Replays | The session replays of the users who saw the survey. |
| Content analysis | An AI summary of the open-ended answers. |
| Net Promoter Score, Customer Satisfaction, Customer Effort Score, Net Easy Score, System Usability Scale | The score report, only when the survey has a question of that type. |
| Connect | Send the responses to your other tools, if your role can manage integrations. |
The overview and the score pages are editable reports: what you see first is their default layout. To add, move or remove widgets, click More at the top right, then Customize report. Every teammate of the workspace can do it.
Read the overview
Section titled “Read the overview”The four numbers at the top of Survey analytics answer “is my survey working?”:
- Displays: how many times the survey was shown.
- Responses: displays where the user answered at least one question, whether they finished or not.
- Response rate: responses divided by displays. A low rate points at the trigger, the moment or the first question.
- Completion rate: among the responses, the share that reached the end of the survey. A low rate often means the survey is too long or a question is unclear.
Each number compares with the previous period of the same length.
Read the answers to each question
Section titled “Read the answers to each question”- In the side menu, click All responses. Each row is a question, with its number of responses and, for choice and score questions, a Key result such as the most chosen answer or the NPS.
- Click a question to expand it. You see the split of its answers and, below, the responses one by one.
- Click a bar of the chart to add a filter on that answer. Every page then shows only the responses that gave it.
- To read the answers translated, keep Translate responses automatically on. Translation is a workspace setting, and your own reading language, if you set one, takes over. See Translate responses automatically.
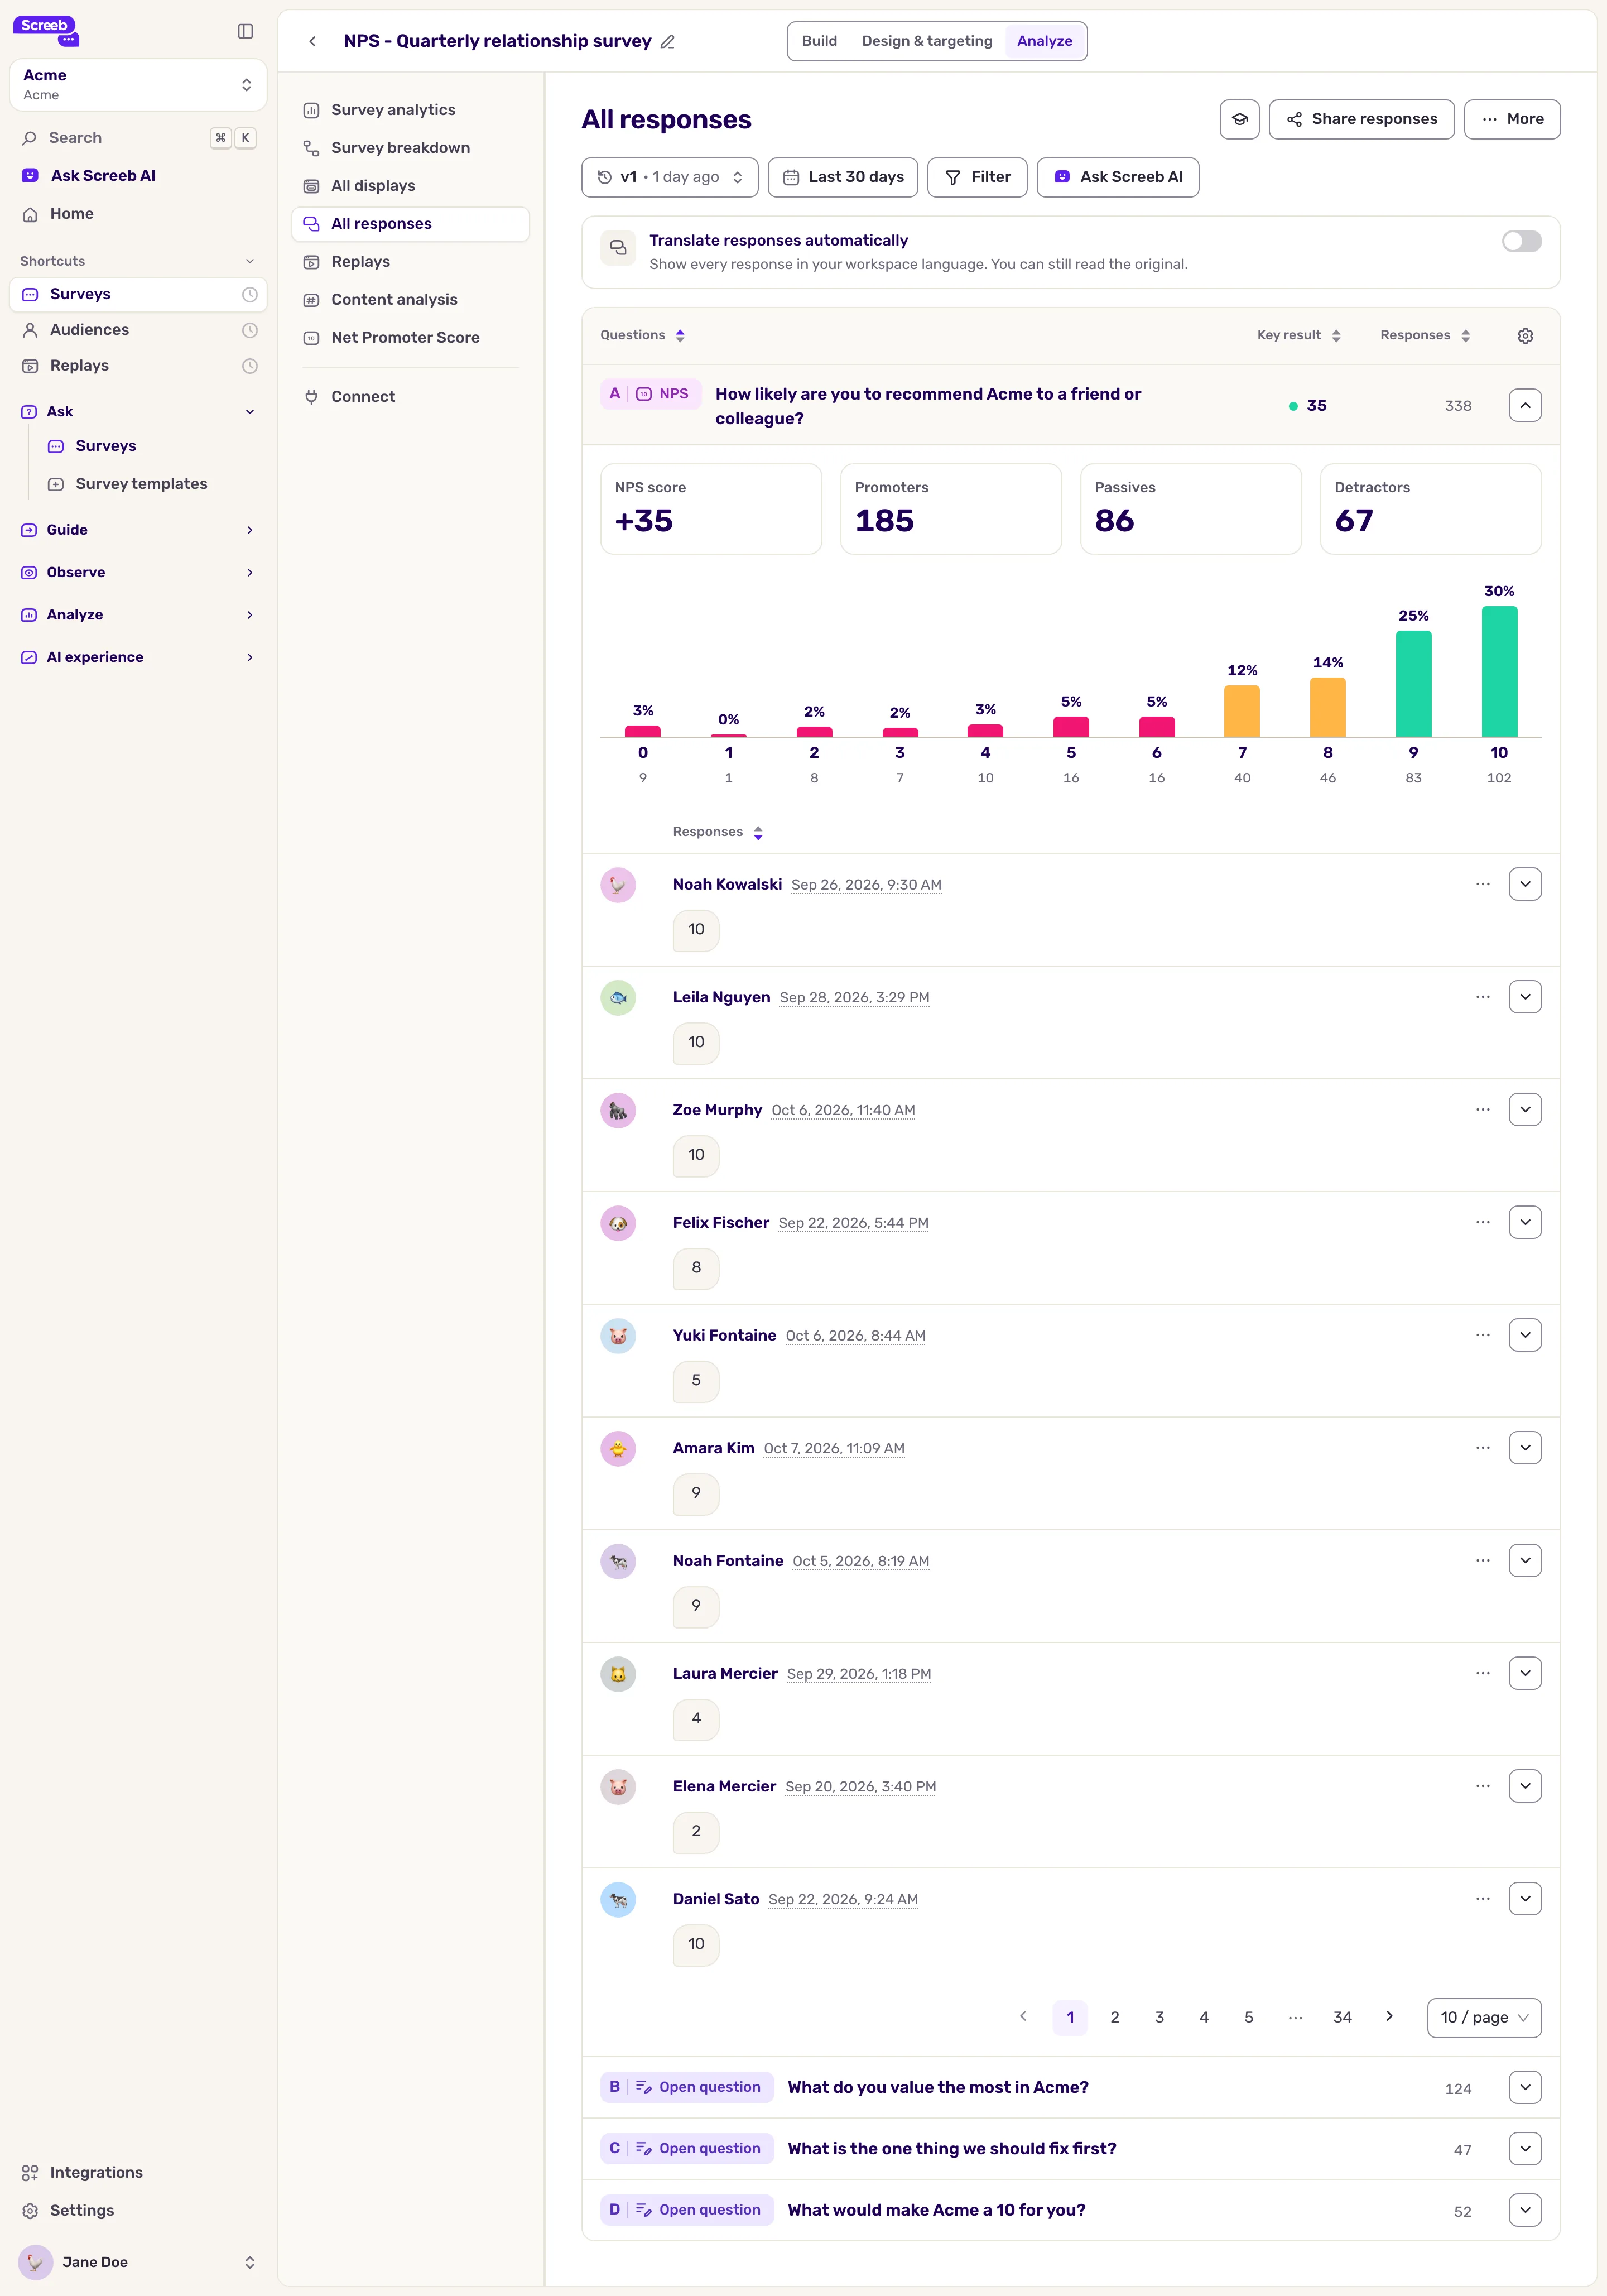
If you changed the questions after launch, pick the version of the survey in the menu at the top left of the page to read the answers given to that version.
Share the responses
Section titled “Share the responses”On All responses, Share responses at the top right sends responses to your team’s tools. It needs a role that lets you edit the survey.
- Click Share responses.
- Choose All responses (every new response) or Filtered responses (only those matching the rules you add). Filtered responses are sent once each response ends.
- Under How do you want to share?, turn on one or more destinations: Slack, Microsoft Teams, Notion, Atlassian or email.
- Click the button at the bottom right. New responses are then sent as they come in.
On Survey analytics and the score pages, the same window is in the More menu: it sends the numbers you pick, once or on the schedule set in Do you want to repeat in the future?.
Tips to read the results right
Section titled “Tips to read the results right”- Wait for enough responses. A score based on a handful of answers moves a lot from one week to the next.
- Look at the trend, not one number. Compare periods, or a segment against the rest. Your releases show on the charts over time, see Track your releases.
- Read the open-ended answers. They explain the scores: filter on the low scores, then read what those users wrote.
- Segment. A good overall score can hide a group of unhappy users: filter by plan, country or seniority.
What you get
Section titled “What you get”A view of how the survey performs, what users answered and why, for the period and the users you chose.