

How Screeb calculates NES
Understand how Screeb groups Net Easy Score answers on a 5 or 7 point scale, calculates the score from -100 to +100, judges it, and where it shows.
The Net Easy Score (NES) measures how easy users found a task, such as setting up an integration or finishing a checkout. It reads like the NPS: the share of users who found it easy minus the share who found it difficult. Screeb calculates it from the answers to the NES questions of your survey.
Scale and answer groups
Section titled “Scale and answer groups”A NES question is answered from 1 (very difficult) to 5 (very easy) by default. To use a 1 to 7 scale, turn on Scale (1-5 or 1-7) in the question settings of the builder.
| 5-point scale | 7-point scale | Group |
|---|---|---|
| 4 or 5 | 5 to 7 | Easy |
| 3 | 3 or 4 | Neutral |
| 1 or 2 | 1 or 2 | Difficult |
Use the same scale on every NES question of a survey: the report reads the scale of the first NES question for all of them.
Pick the scale before you launch
Changing the scale of a live question changes the group of the answers already collected, so the score jumps. Word the question and its legends so that a high answer means “easy”. Inverted order only changes the order of the buttons on screen: the highest value still means the easiest.
Formula
Section titled “Formula”NES = % of easy answers - % of difficult answers
Both percentages are taken over every answer to the question, neutral answers included. The score goes from -100 (only difficult answers) to +100 (only easy ones) and is rounded to the nearest whole number. In the Key result column of the answer list, it shows without the plus sign, for example 45; the sign shows in its tooltip and when you expand the question, for example +45.
The answers counted are those given in the selected period and matching your filters, including the answers of users who did not finish the survey. If the survey has several NES questions, their answers are counted together.
Example
Section titled “Example”On a 5-point scale:
| Answer | Count | Group |
|---|---|---|
| 1 | 5 | Difficult |
| 2 | 10 | Difficult |
| 3 | 25 | Neutral |
| 4 | 35 | Easy |
| 5 | 25 | Easy |
| Total | 100 |
- Easy = (35 + 25) / 100 = 60%
- Difficult = (5 + 10) / 100 = 15%
- NES = 60 - 15 = +45
On a 7-point scale, answers of 5, 6 and 7 count as easy, and 3 and 4 as neutral.
How the admin judges the score
Section titled “How the admin judges the score”| NES | Judgment |
|---|---|
| Below 0 | poor |
| 0 to 30 | fair |
| Above 30 | good |
These bands color the gauge and the dot in the Key result column. In the example, +45 is good. Follow the trend of your NES for a given task rather than a single value.
Where the NES shows
Section titled “Where the NES shows”The NES report. Open the survey, click Analyze, then Net Easy Score in the side menu. The entry shows only when the survey has a NES question. Its default layout gives the NES, the number of easy, neutral and difficult answers, a gauge from -100 to +100, the Result distribution of the answers, the trend over time and the NES per cohort table. Only the score and the trend compare with the previous period. The report is editable: click More, then Customize report.
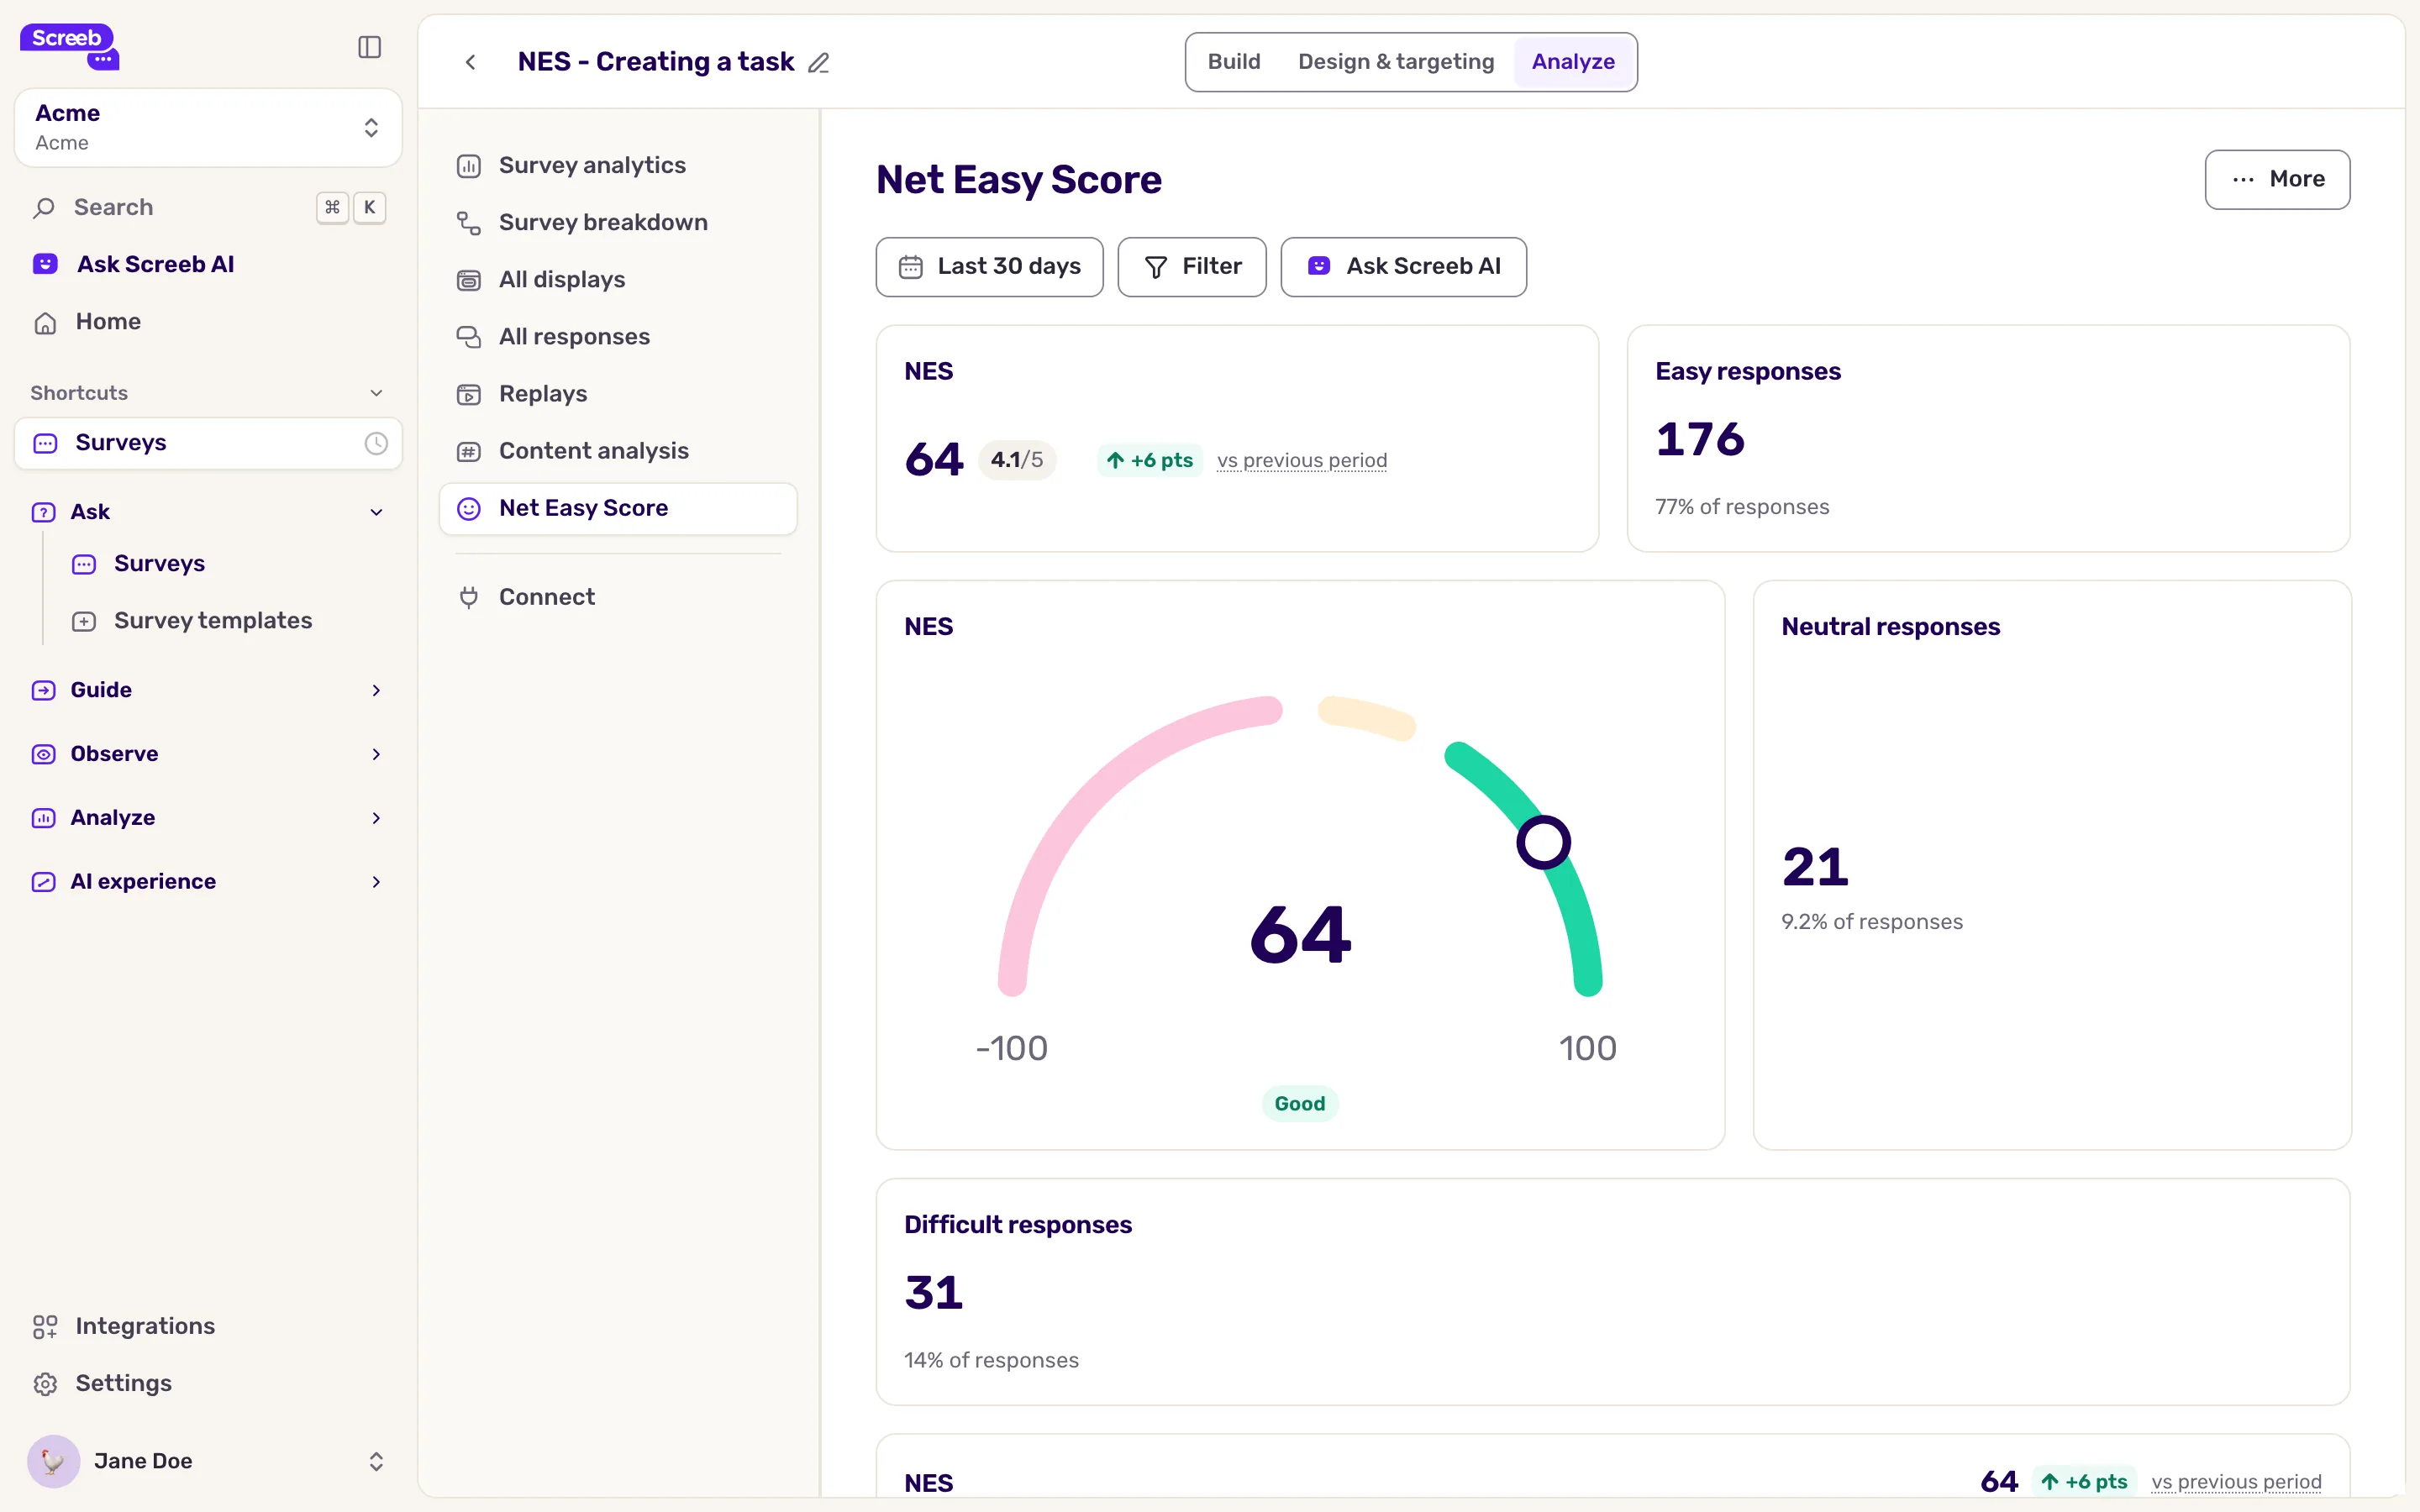
The answers to the question. In All responses, the Key result column of the NES question shows the score and its judgment. Expand the question to see the Score and the share of easy, neutral and difficult answers.
Reports. You can add NES widgets to your workspace reports and home page, for one survey or several. See Build workspace and organization reports.