

Follow respondents step by step
Use the survey breakdown to see how many displays reach each step of a survey, which answers users pick, and where they drop off.
The survey breakdown draws your survey as it is built, step by step, and shows how many displays reach each step and which way users go. Use it to find the question where users stop, and the answers that lead them there.
Before you start
Section titled “Before you start”- The survey has responses in the period you look at. See Read your survey results.
- The breakdown is available on every plan.
Open the breakdown
Section titled “Open the breakdown”- Open the survey and click Analyze in the header.
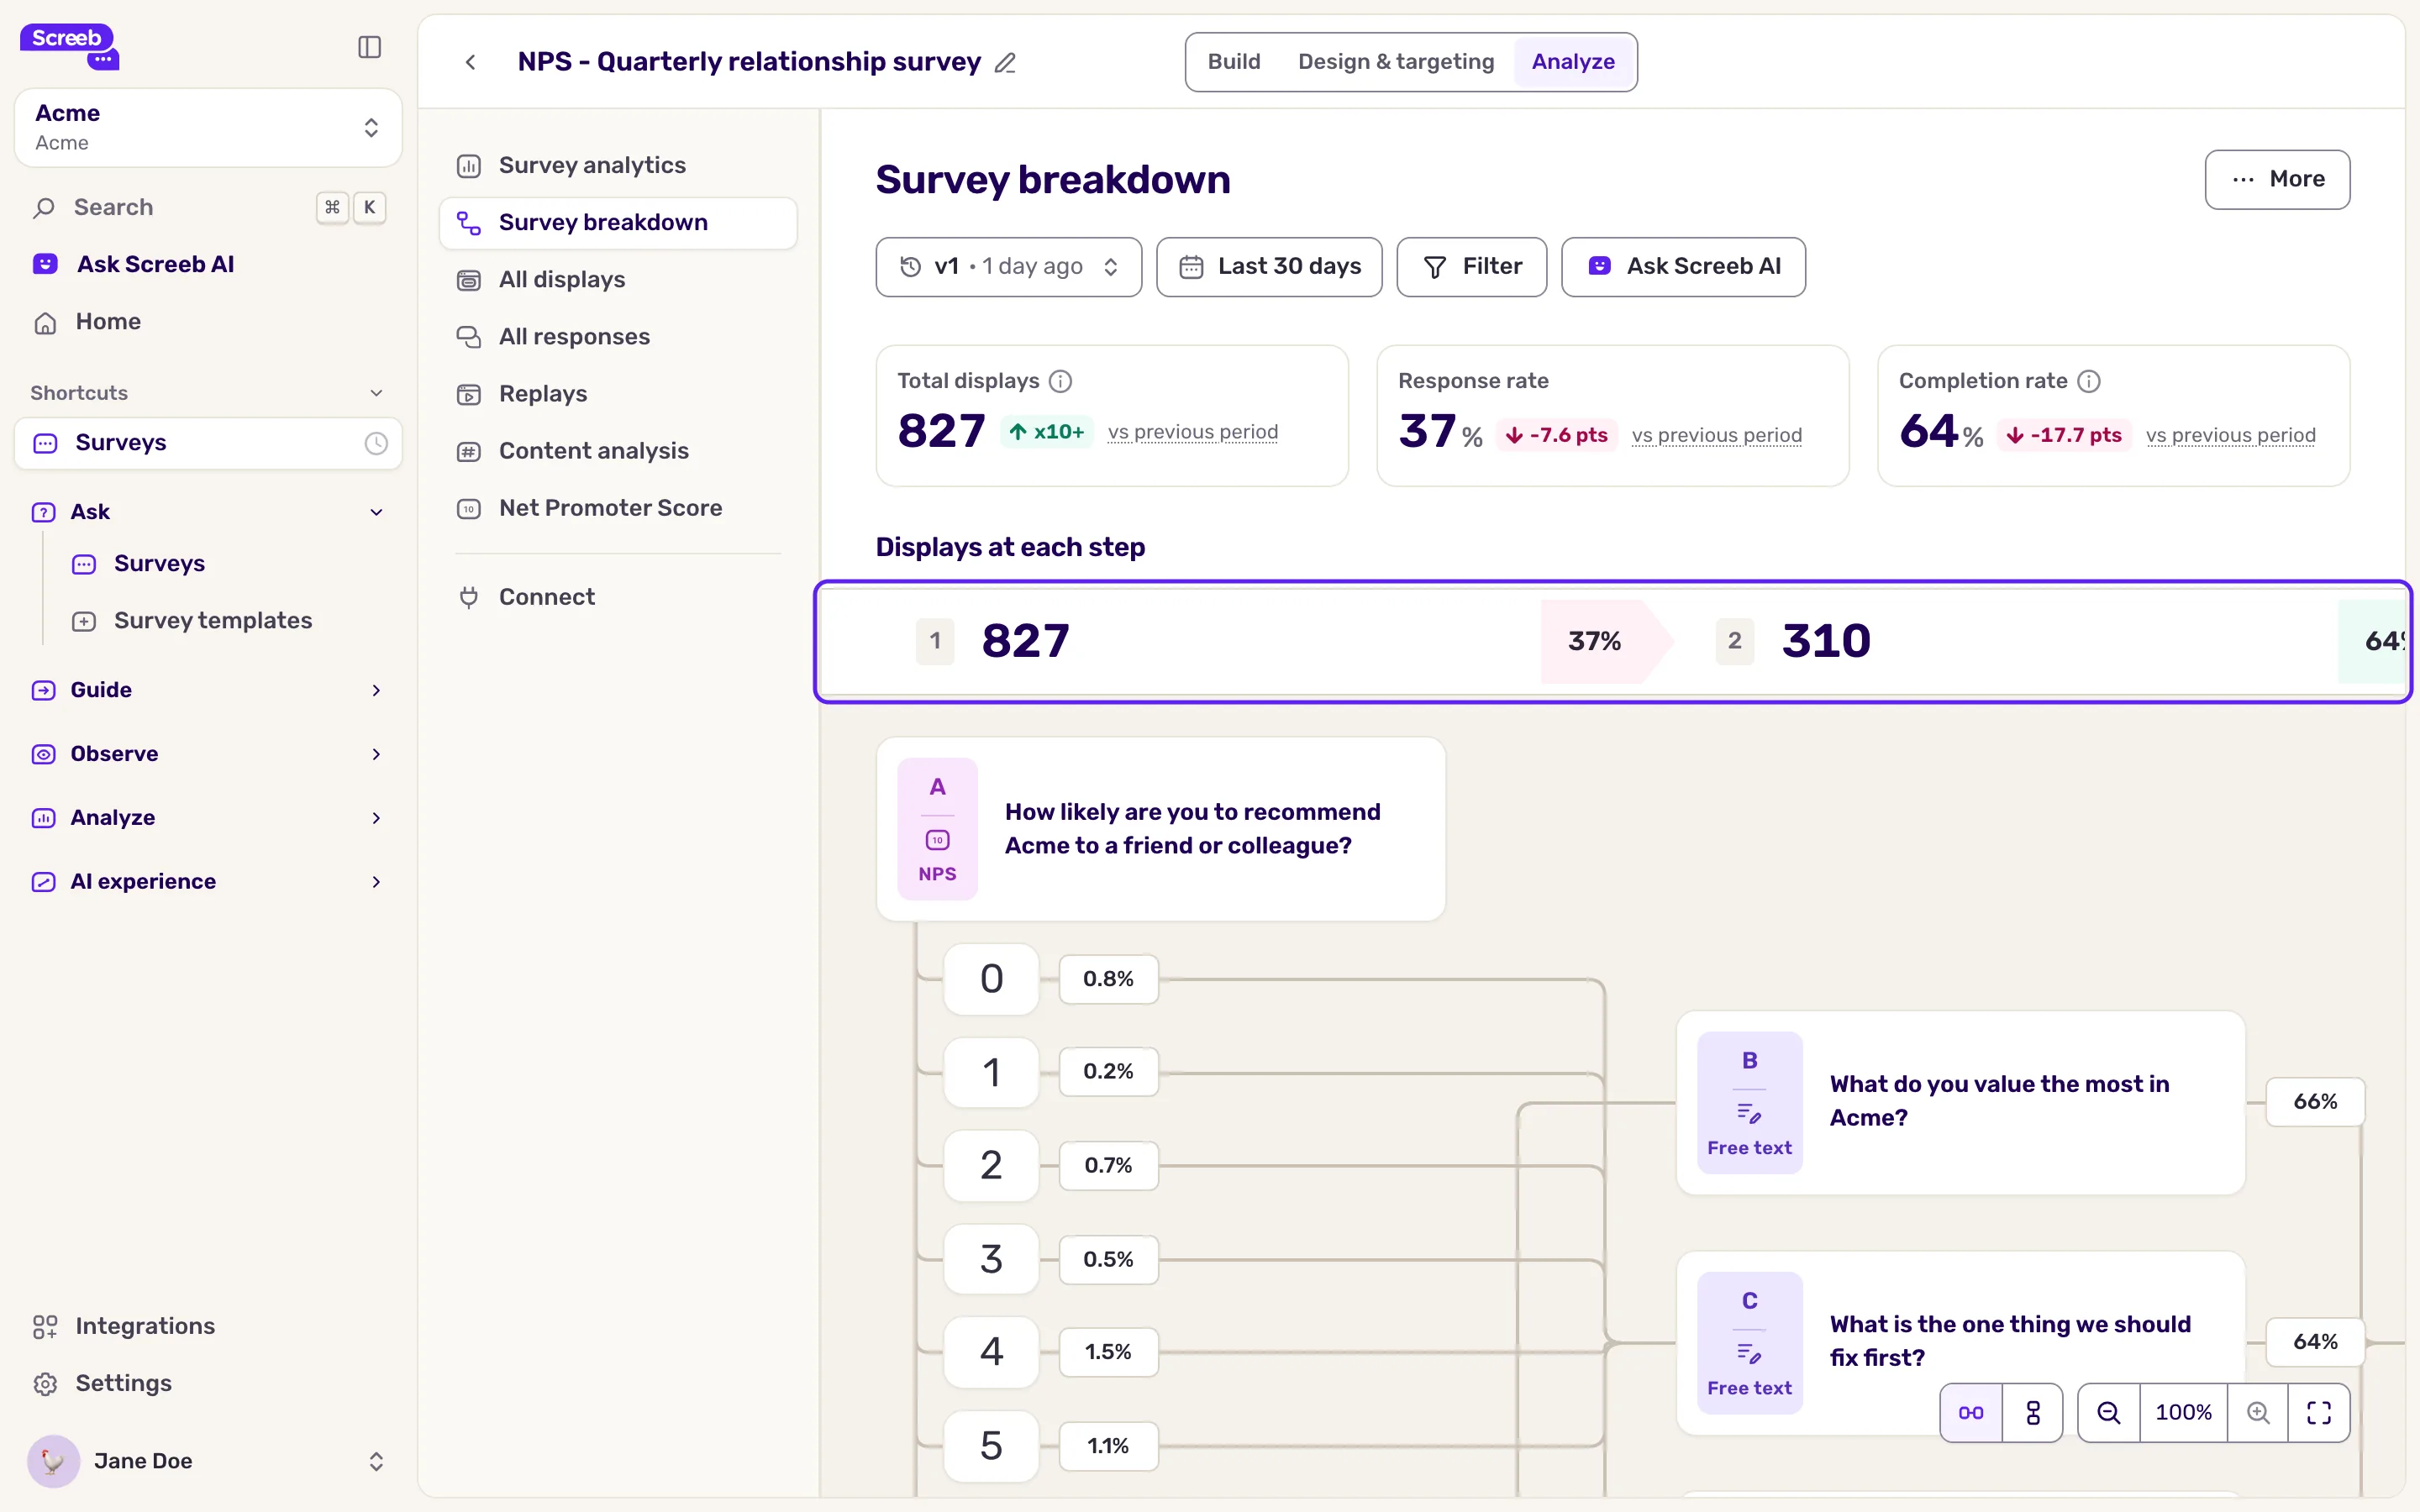
- In the side menu, click Survey breakdown. The page shows three figures at the top, then the flow of the survey.
- Pick the period in the date picker. To narrow the respondents, click Filter, see Filter survey responses. The flow and the figures update.
- If you changed the questions after launch, pick the version of the survey in the menu on the left of the toolbar. The flow then shows that version and the responses given to it.
Read the figures at the top
Section titled “Read the figures at the top”- Total displays: every time the survey showed, including the times it was closed right away.
- Response rate: the share of displays where the user answered at least one question.
- Completion rate: the share of responses that went to the end of the survey. Hover the information icon next to its name to see the same rate compared with all displays.
Each figure compares with the previous period of the same length.
Read the steps
Section titled “Read the steps”The flow lays the questions out in steps, in the order respondents meet them. Questions that only some users see, after a branch, share the step where they appear. Above the flow (or beside it, see below), the Displays at each step legend shows for each step:
- its number;
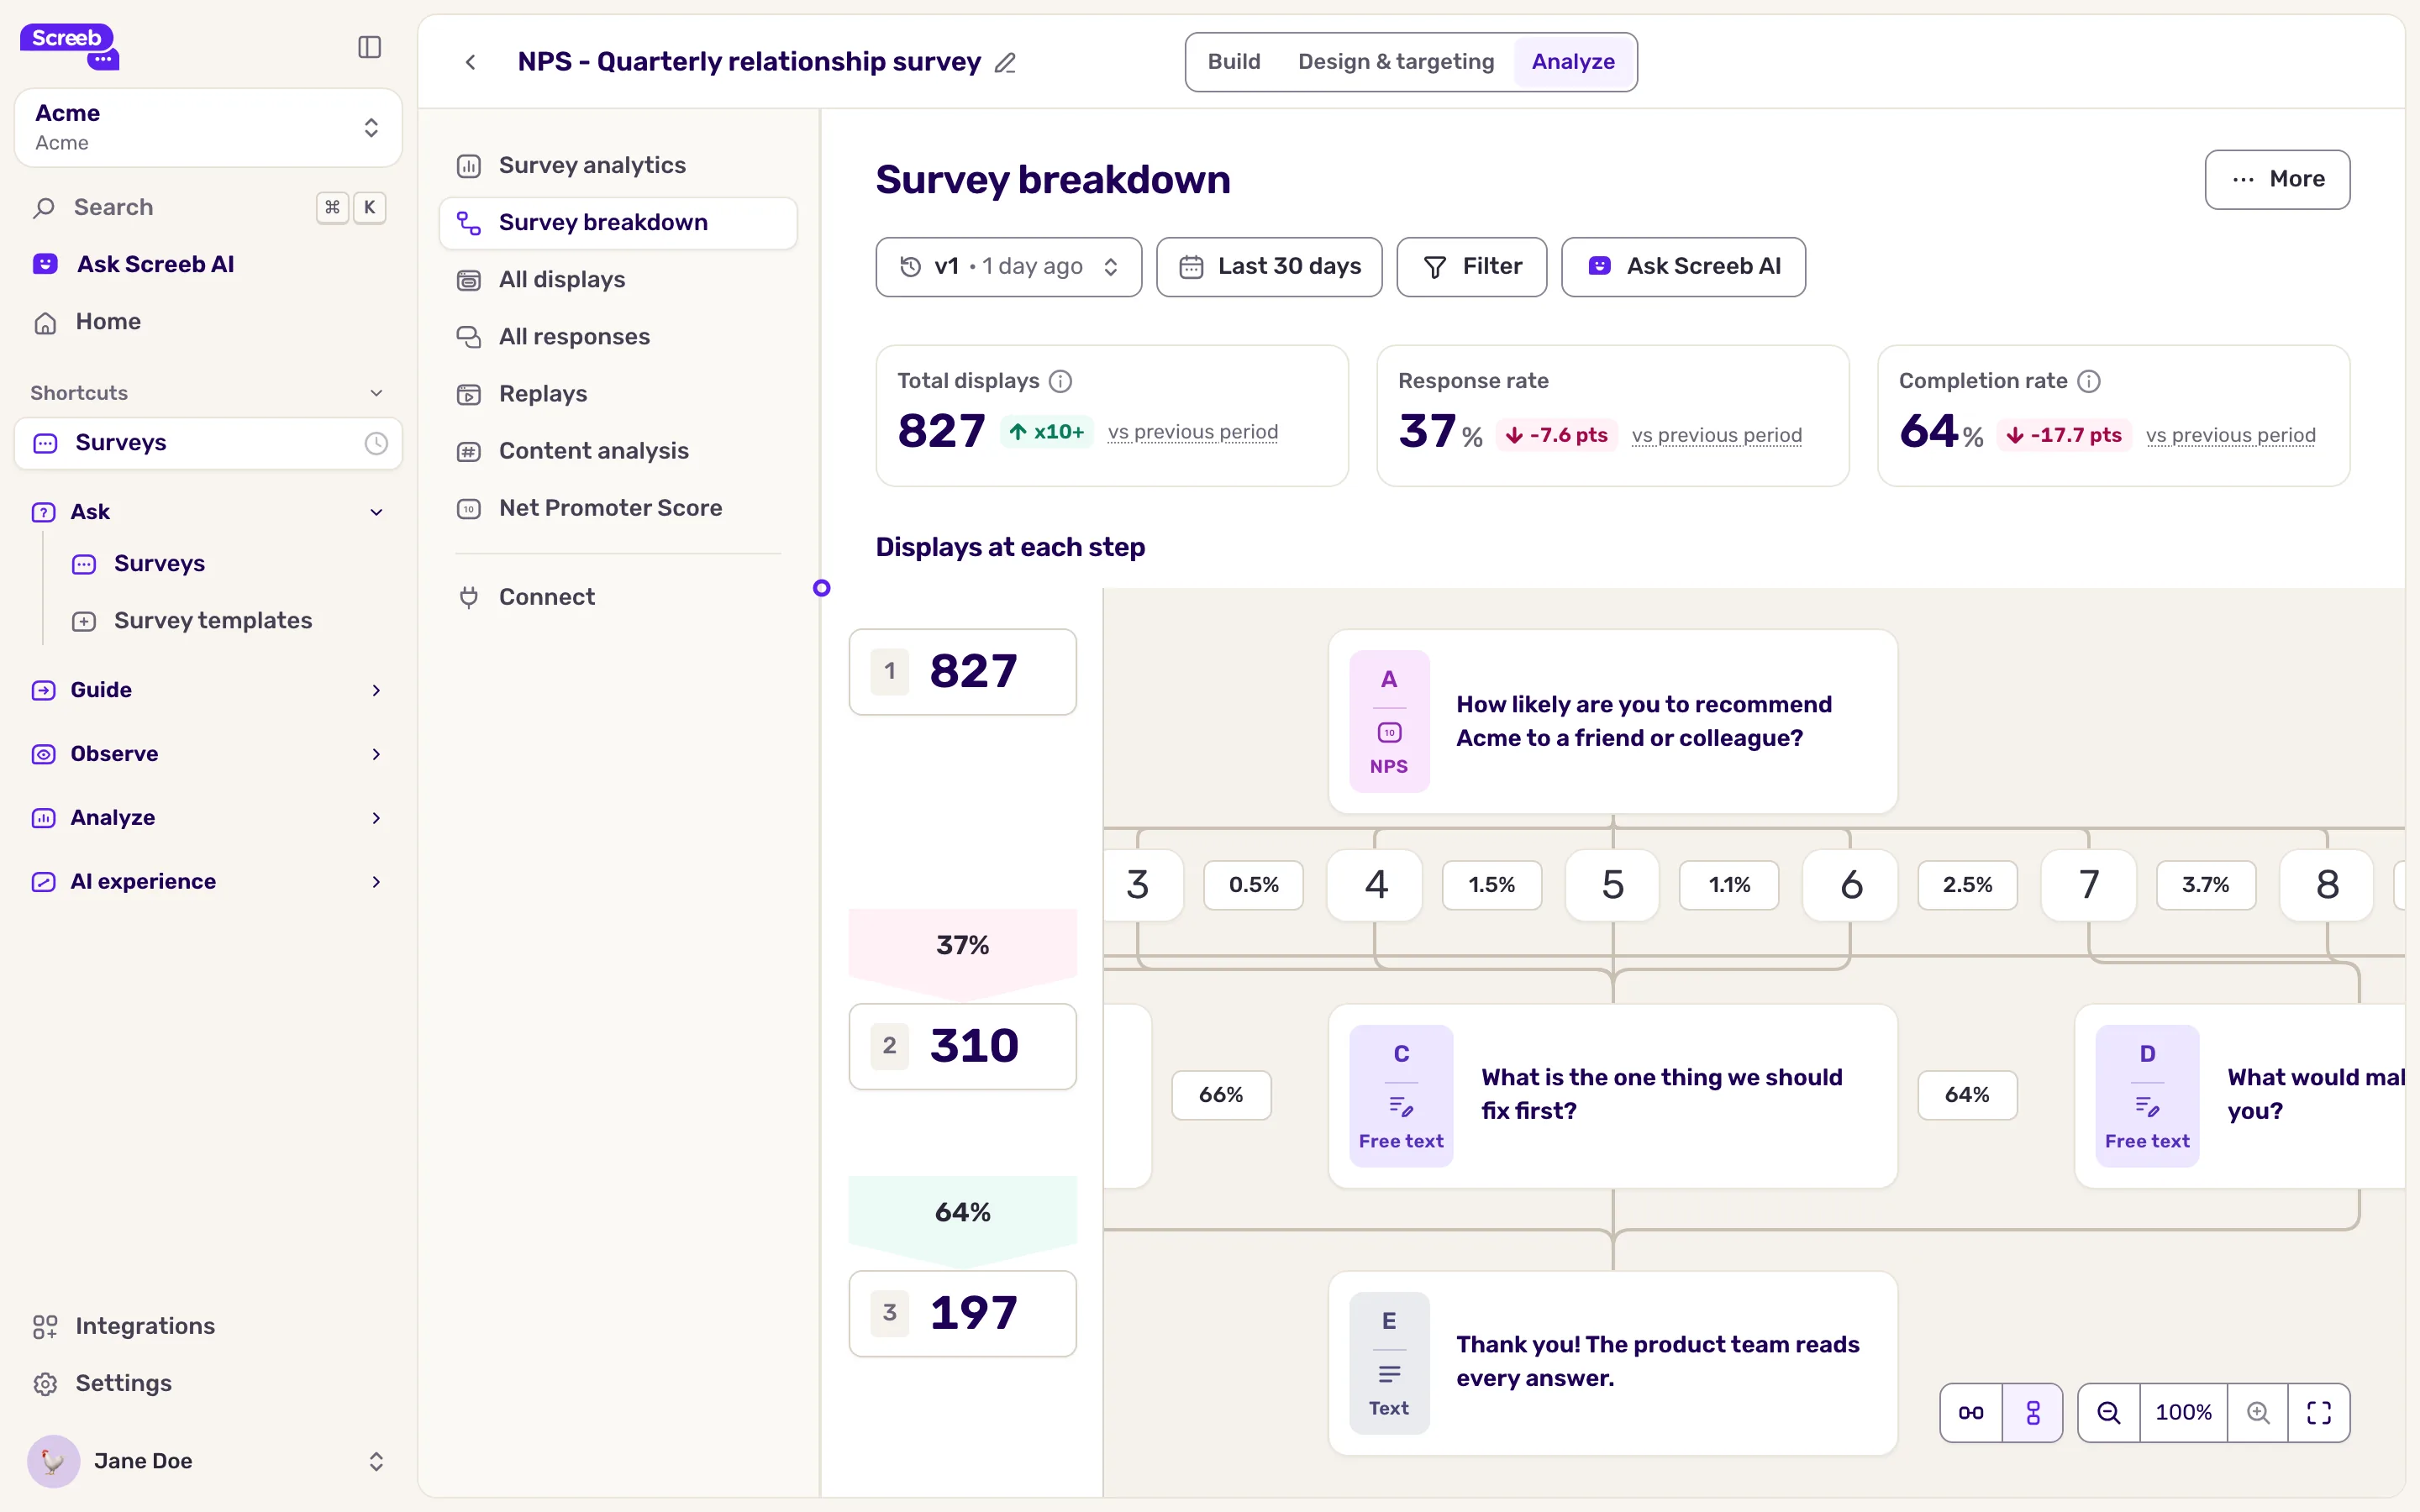
- the displays that reached it, including the ones where the user did not answer: the sum of the displays of every question of that step;
- the share that goes on to the next step, in green from 60%, in orange from 40% to 59%, and in red below 40%. A red step is the first place to look.
Each question card then shows where its users go:
- Choice and score questions: each answer is its own card, with its share of the displays of the step. Displays left unanswered count too, so the shares of a question can add up to less than 100%. Follow the links from an answer to see where it leads.
- Free-text and slider questions: the share of displays where the user answered and went on.
- Skipped questions: when a question can be skipped, the share of users who skipped it shows on its skip link.
A share shows only on the links that lead to another step: the answers that end the survey show none.
Change the layout
Section titled “Change the layout”The controls at the bottom right of the flow change how you see it:
- Horizontal flow and Vertical flow draw the survey from left to right or from top to bottom. In the vertical layout, the step numbers and counts move to the left side of the flow and scroll with it. Your choice is remembered in your browser, for the breakdown and the builder.
- The zoom buttons zoom in and out, and Fit to screen fits the whole survey on the screen.
- Drag the background to move around a large survey.
What you get
Section titled “What you get”The path respondents take through your survey: the step where most of them stop, and the answers that send them to each branch. To read what they wrote at that step, open All responses with the same filters.
Troubleshooting
Section titled “Troubleshooting”Every step shows 0. No response matches the period and the filters: the flow still draws every step, with zero counts. Widen the period, or remove a filter.
A step shows no share. Nobody reached that step in the period, or it is the last step of the survey.
The flow does not match the builder. You are looking at an older version of the survey. Pick the current version in the menu of the toolbar.