

How Screeb calculates CES
Understand how Screeb calculates the Customer Effort Score as an average from 1 to 7, groups the answers by effort, judges the score, and where it shows.
The Customer Effort Score (CES) measures how much effort users make to complete an action, such as finding a feature or finishing a checkout. Screeb calculates it from the answers to the CES questions of your survey.
Scale and answer groups
Section titled “Scale and answer groups”A CES question is answered from 1 to 7. Screeb reads 1 as the least effort and 7 as the most: for the CES, lower is better.
| Answer | Group |
|---|---|
| 1 to 3 | Low effort |
| 4 or 5 | Medium effort |
| 6 or 7 | High effort |
Word the question for this scale
Write the question and its legends so that a low answer means “easy”, for example “How much effort did it take to export your data?”, from “Very little” to “A lot”. Inverted order in the question settings only changes the order of the buttons on screen: 1 still means the least effort.
Formula
Section titled “Formula”CES = sum of the answers / number of answers
The CES is an average from 1 to 7. The answer list shows it with one decimal, for example 2.8 / 7. Each group is also shown as a share of all answers.
The answers counted are those given in the selected period and matching your filters, including the answers of users who did not finish the survey. If the survey has several CES questions, their answers are counted together.
Example
Section titled “Example”| Answer | Count |
|---|---|
| 1 | 25 |
| 2 | 30 |
| 3 | 20 |
| 4 | 10 |
| 5 | 5 |
| 6 | 5 |
| 7 | 5 |
| Total | 100 |
- CES = (1x25 + 2x30 + 3x20 + 4x10 + 5x5 + 6x5 + 7x5) / 100 = 2.75, shown as 2.8 / 7
- Low effort = 75%, Medium effort = 15%, High effort = 10%
How the admin judges the score
Section titled “How the admin judges the score”| CES | Judgment |
|---|---|
| Below 4 | good |
| 4 to 5 | fair |
| Above 5 | poor |
These bands color the gauge and the dot in the Key result column. In the example, 2.75 is good.
Where the CES shows
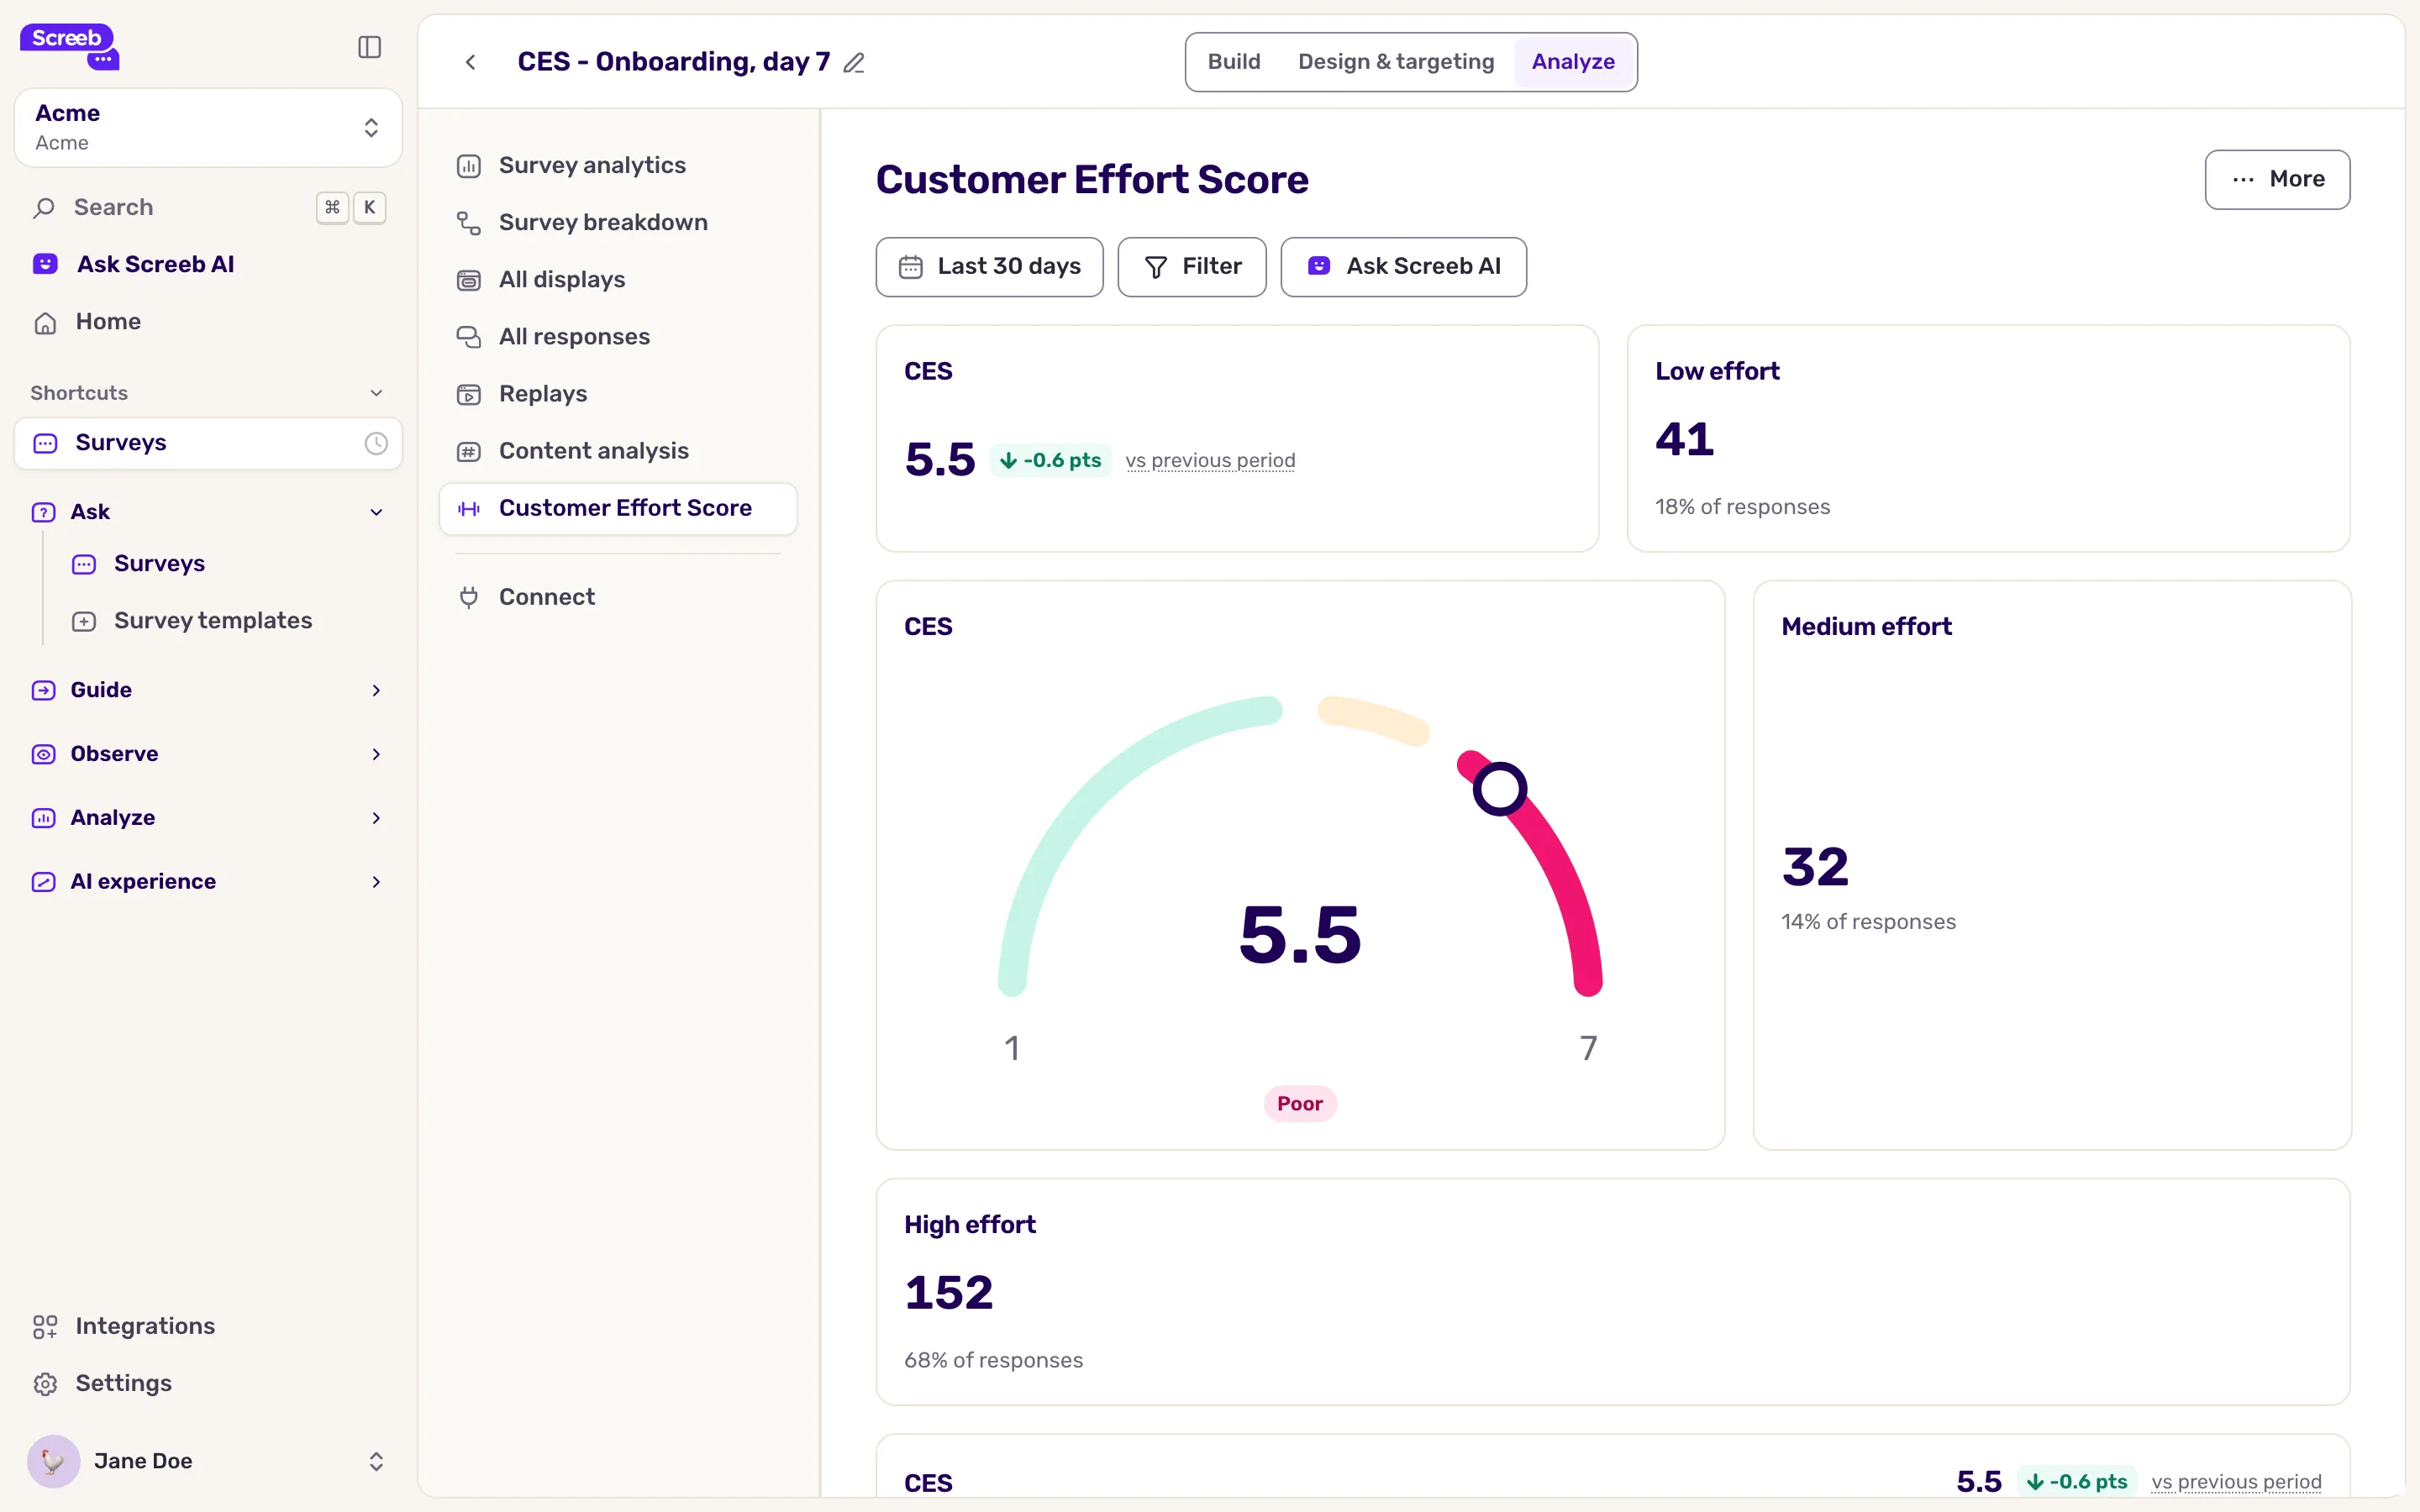
Section titled “Where the CES shows”The CES report. Open the survey, click Analyze, then Customer Effort Score in the side menu. The entry shows only when the survey has a CES question. Its default layout gives the CES, the number of answers in each effort group, a gauge from 1 to 7, the Result distribution from 1 to 7, the trend over time and the CES per cohort table. Only the score and the trend compare with the previous period. The report is editable: click More, then Customize report.
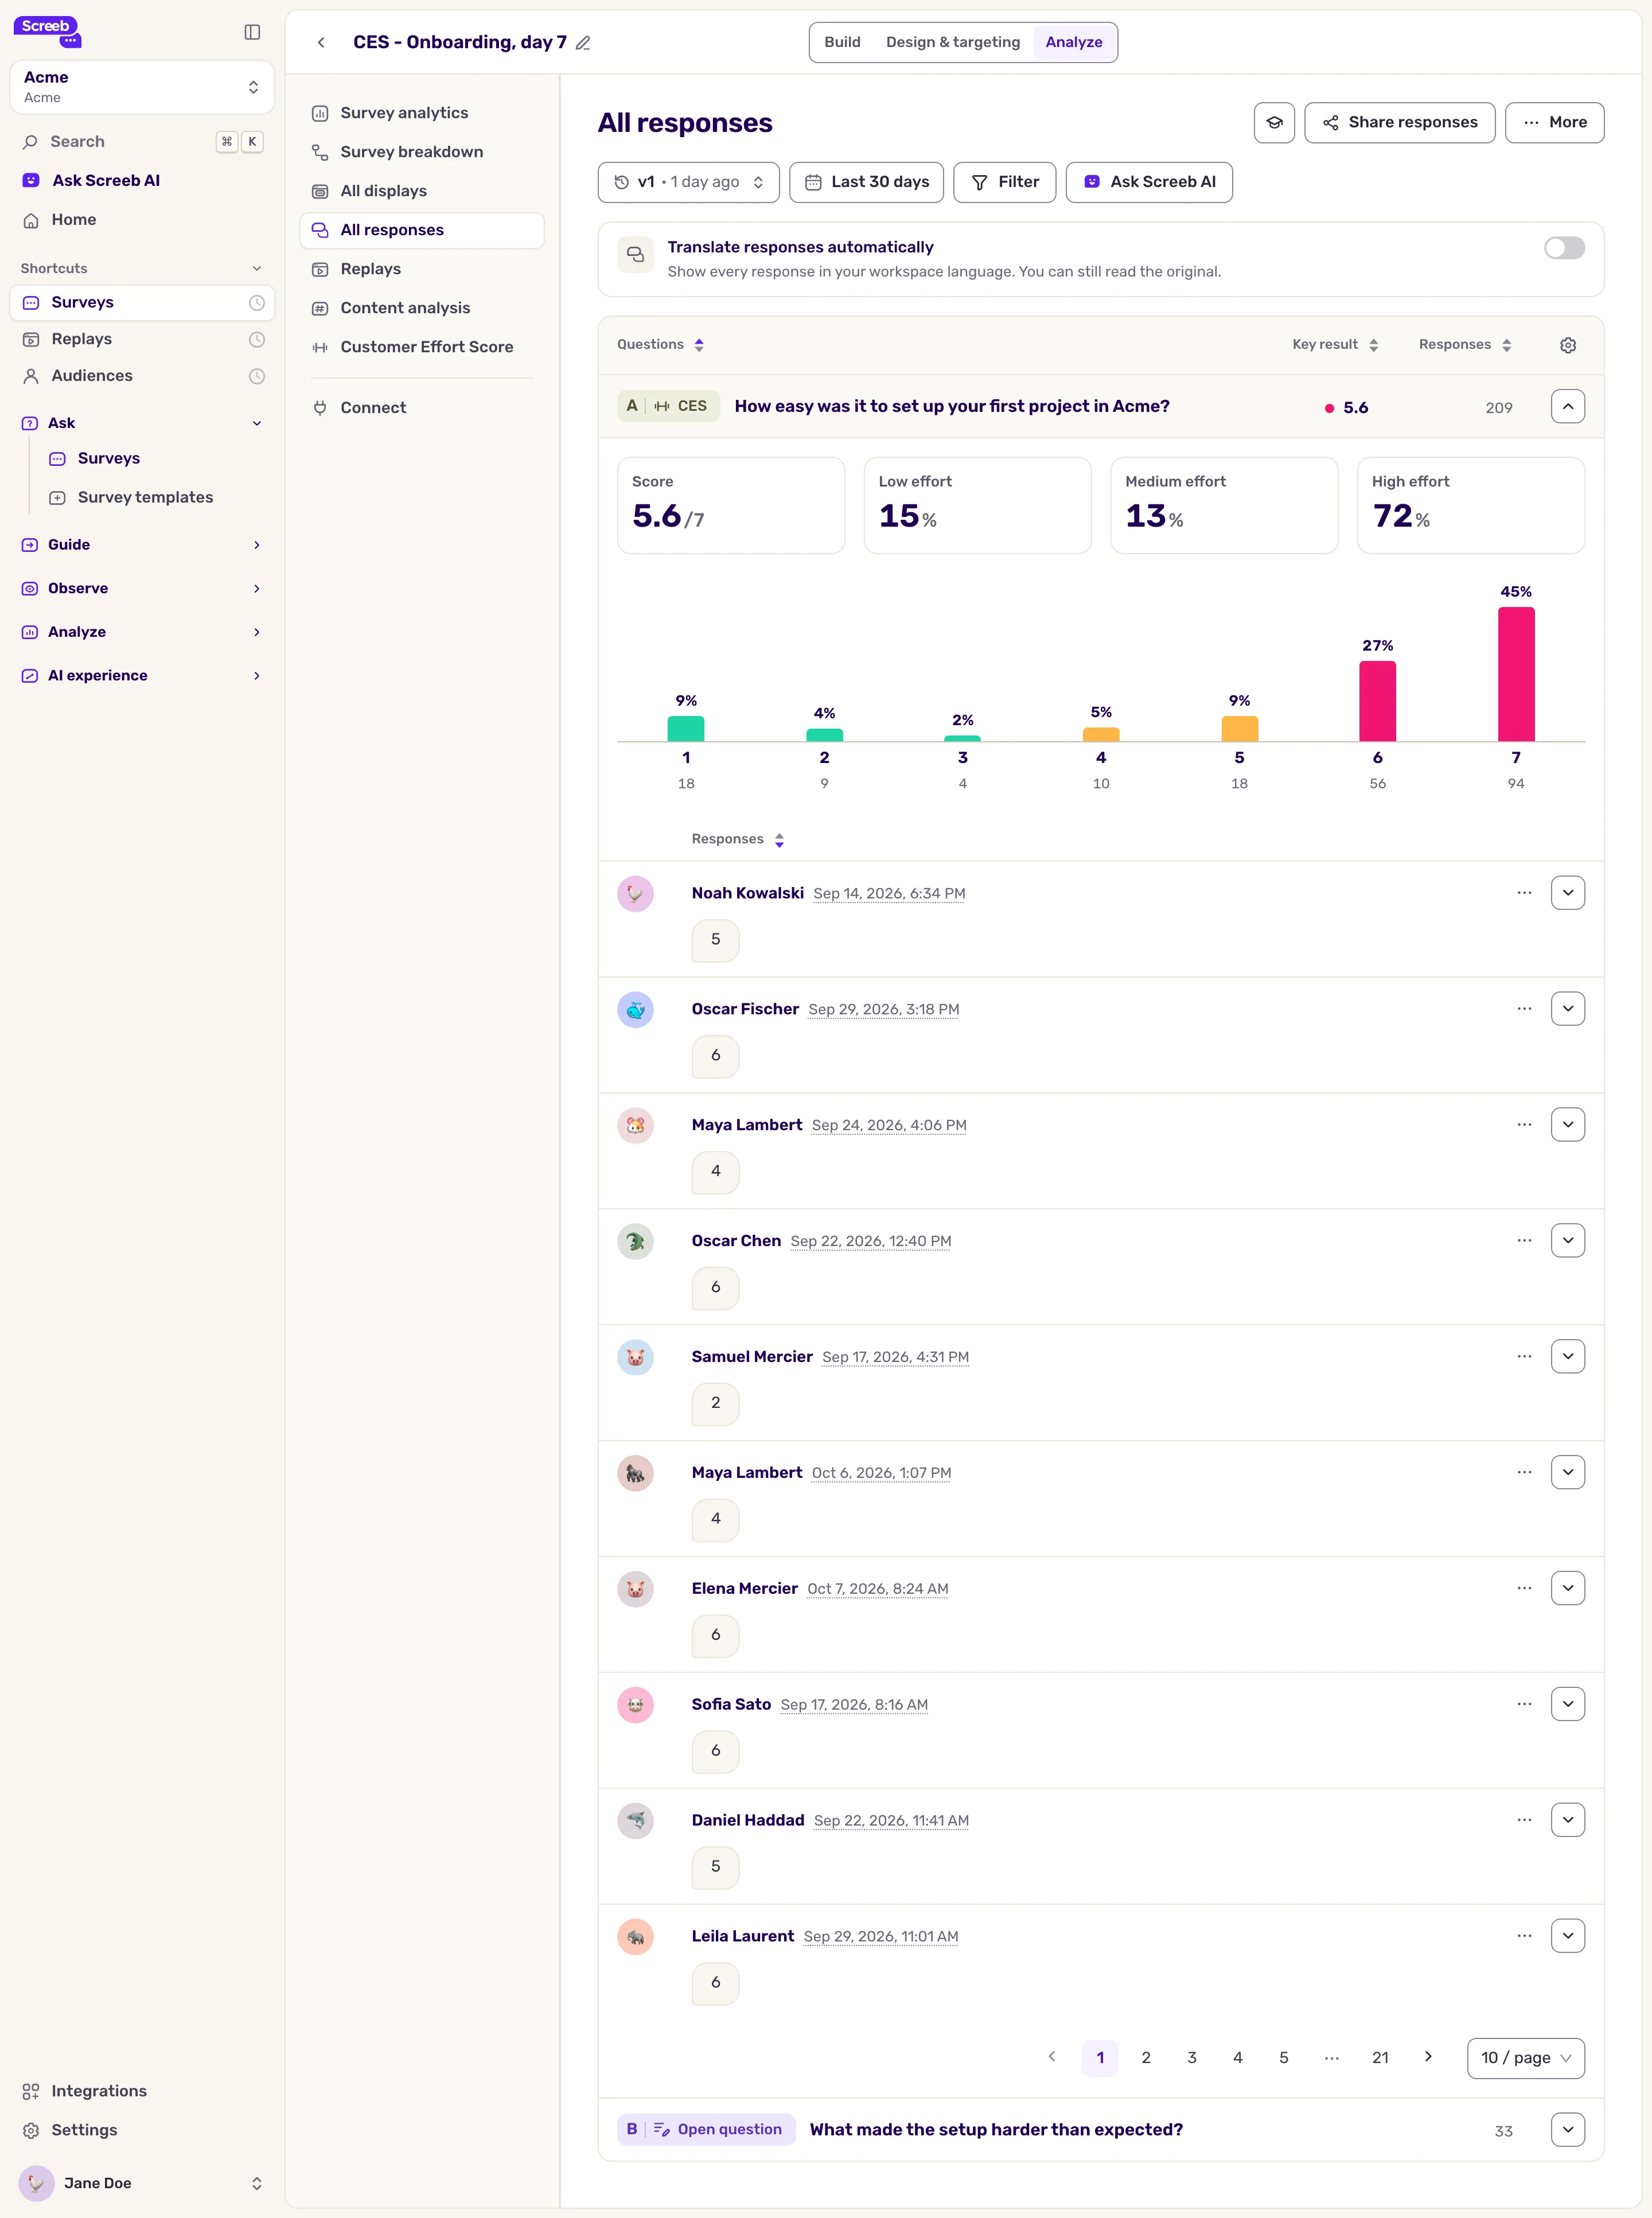
The answers to the question. In All responses, the Key result column of the CES question shows the average and its judgment. Expand the question to see the Score out of 7 and the share of each effort group.
Reports. You can add CES widgets to your workspace reports and home page, for one survey or several. See Build workspace and organization reports.