

How Screeb calculates SUS
Understand the System Usability Scale question, how Screeb scores it from 0 to 100, the difference between the complete and the partial SUS, and where it shows.
The System Usability Scale (SUS) measures how usable users find a product, such as your app, a back office or a new feature. It is a standard questionnaire of ten statements, scored from 0 to 100, that researchers have used for decades, so you can compare your result with published benchmarks. Screeb scores it from the answers to the SUS question of your survey.
Statements and answers
Section titled “Statements and answers”To add it, open the question type menu of the builder and pick SUS in the Scores group. The question comes with its ten statements. Each one is answered on five levels, from Strongly disagree to Strongly agree.
The statements alternate between positive and negative wording. Each one covers a fixed theme:
| Statement | Theme | Wording |
|---|---|---|
| 1 | Using the product often | Positive |
| 2 | Unnecessary complexity | Negative |
| 3 | Ease of use | Positive |
| 4 | Needing the help of a technical person | Negative |
| 5 | Functions that fit well together | Positive |
| 6 | Inconsistency | Negative |
| 7 | Other people learning it quickly | Positive |
| 8 | Feeling cumbersome | Negative |
| 9 | Confidence while using it | Positive |
| 10 | Needing to learn a lot before starting | Negative |
You can reword the statements and the five answer labels, for example to replace “system” by the name of your product. You cannot add, remove or reorder the statements, nor change the number of answers: the ten statements in this order are what makes a score comparable.
Users can skip the whole question and, in some survey formats, send it with some statements left unanswered. A statement left unanswered is not counted.
Keep the meaning of each statement
The score reverses the answers to the negative statements, so rewording a statement into its opposite flips its contribution. Change the product name or the tone, not the idea.
Formula
Section titled “Formula”For each user, Screeb gives every answered statement a value from 0 to 4, where 4 is the most favourable answer:
- on a positive statement (1, 3, 5, 7, 9), the value is the answer minus 1, with the answers numbered from 1 for Strongly disagree to 5 for Strongly agree;
- on a negative statement (2, 4, 6, 8, 10), the value is 5 minus the answer.
SUS = sum of the ten values x 2.5
The score of a survey is the average of the scores of its users. It goes from 0 (the worst answer to every statement) to 100 (the best one), and shows with one decimal.
Example
Section titled “Example”- A user answers 3, the middle answer, to every statement. Each value is 2, the sum is 20 and the SUS is 20 x 2.5 = 50.
- A user agrees strongly with every positive statement and disagrees strongly with every negative one. Each value is 4, the sum is 40 and the SUS is 100.
A SUS is not a percentage
A score of 70 does not mean 70% of users are satisfied. Across the studies published by Sauro and Lewis, the average SUS is 68: a score below 68 is below average, and a score above it is above average.
Complete and partial SUS
Section titled “Complete and partial SUS”Screeb gives you two indicators, because not every user answers the ten statements:
| Indicator | Counts | Score of a user |
|---|---|---|
| SUS | Only the users who answered all ten statements | The standard score above |
| SUS (partial) | The users who answered all the statements, and those who answered only some | The values of the statements answered, scaled to ten statements |
For a user who answered only some statements, the partial score is 100 x the sum of the values of the answered statements / (4 x the number of statements answered). With all ten answered, it is exactly the standard SUS, so the two indicators are equal when every user finishes the question.
For example, a user who answers only the first two statements, with 5 on statement 1 and 1 on statement 2, gets two values of 4. Their partial score is 100 x 8 / (4 x 2) = 100. They do not count in the SUS, because the other eight statements are missing.
Use the SUS to compare with the benchmark, and the SUS (partial) to keep every answer in sight when some users leave statements unanswered. A gap between the two means the users who answer everything do not rate the product like the others.
How the admin judges the score
Section titled “How the admin judges the score”| SUS | Judgment |
|---|---|
| Below 62.7 | poor |
| 62.7 to 72.5 | fair |
| 72.6 and above | good |
These bands follow the curved grades of Sauro and Lewis: from 72.6, the product scores above the average of the published studies. They color the gauge and the dot of the score. The average of 68 sits in the middle band. Follow the trend of your SUS between two versions of your product rather than a single value.
Where the SUS shows
Section titled “Where the SUS shows”The SUS report. Open the survey, click Analyze, then System Usability Scale in the side menu. The entry shows only when the survey has a SUS question. Its default layout gives the SUS and the SUS (partial), a gauge from 0 to 100, the number of responses in each judgment band, the distribution of the scores in bands of ten points, and below it, side by side, a donut showing how many answers are complete and how many are not, and the trend over time with a line for each indicator and a dashed line at the average SUS of 68. The line under the page title recalls what separates the SUS from the SUS (partial). The report is editable: click More, then Customize report.
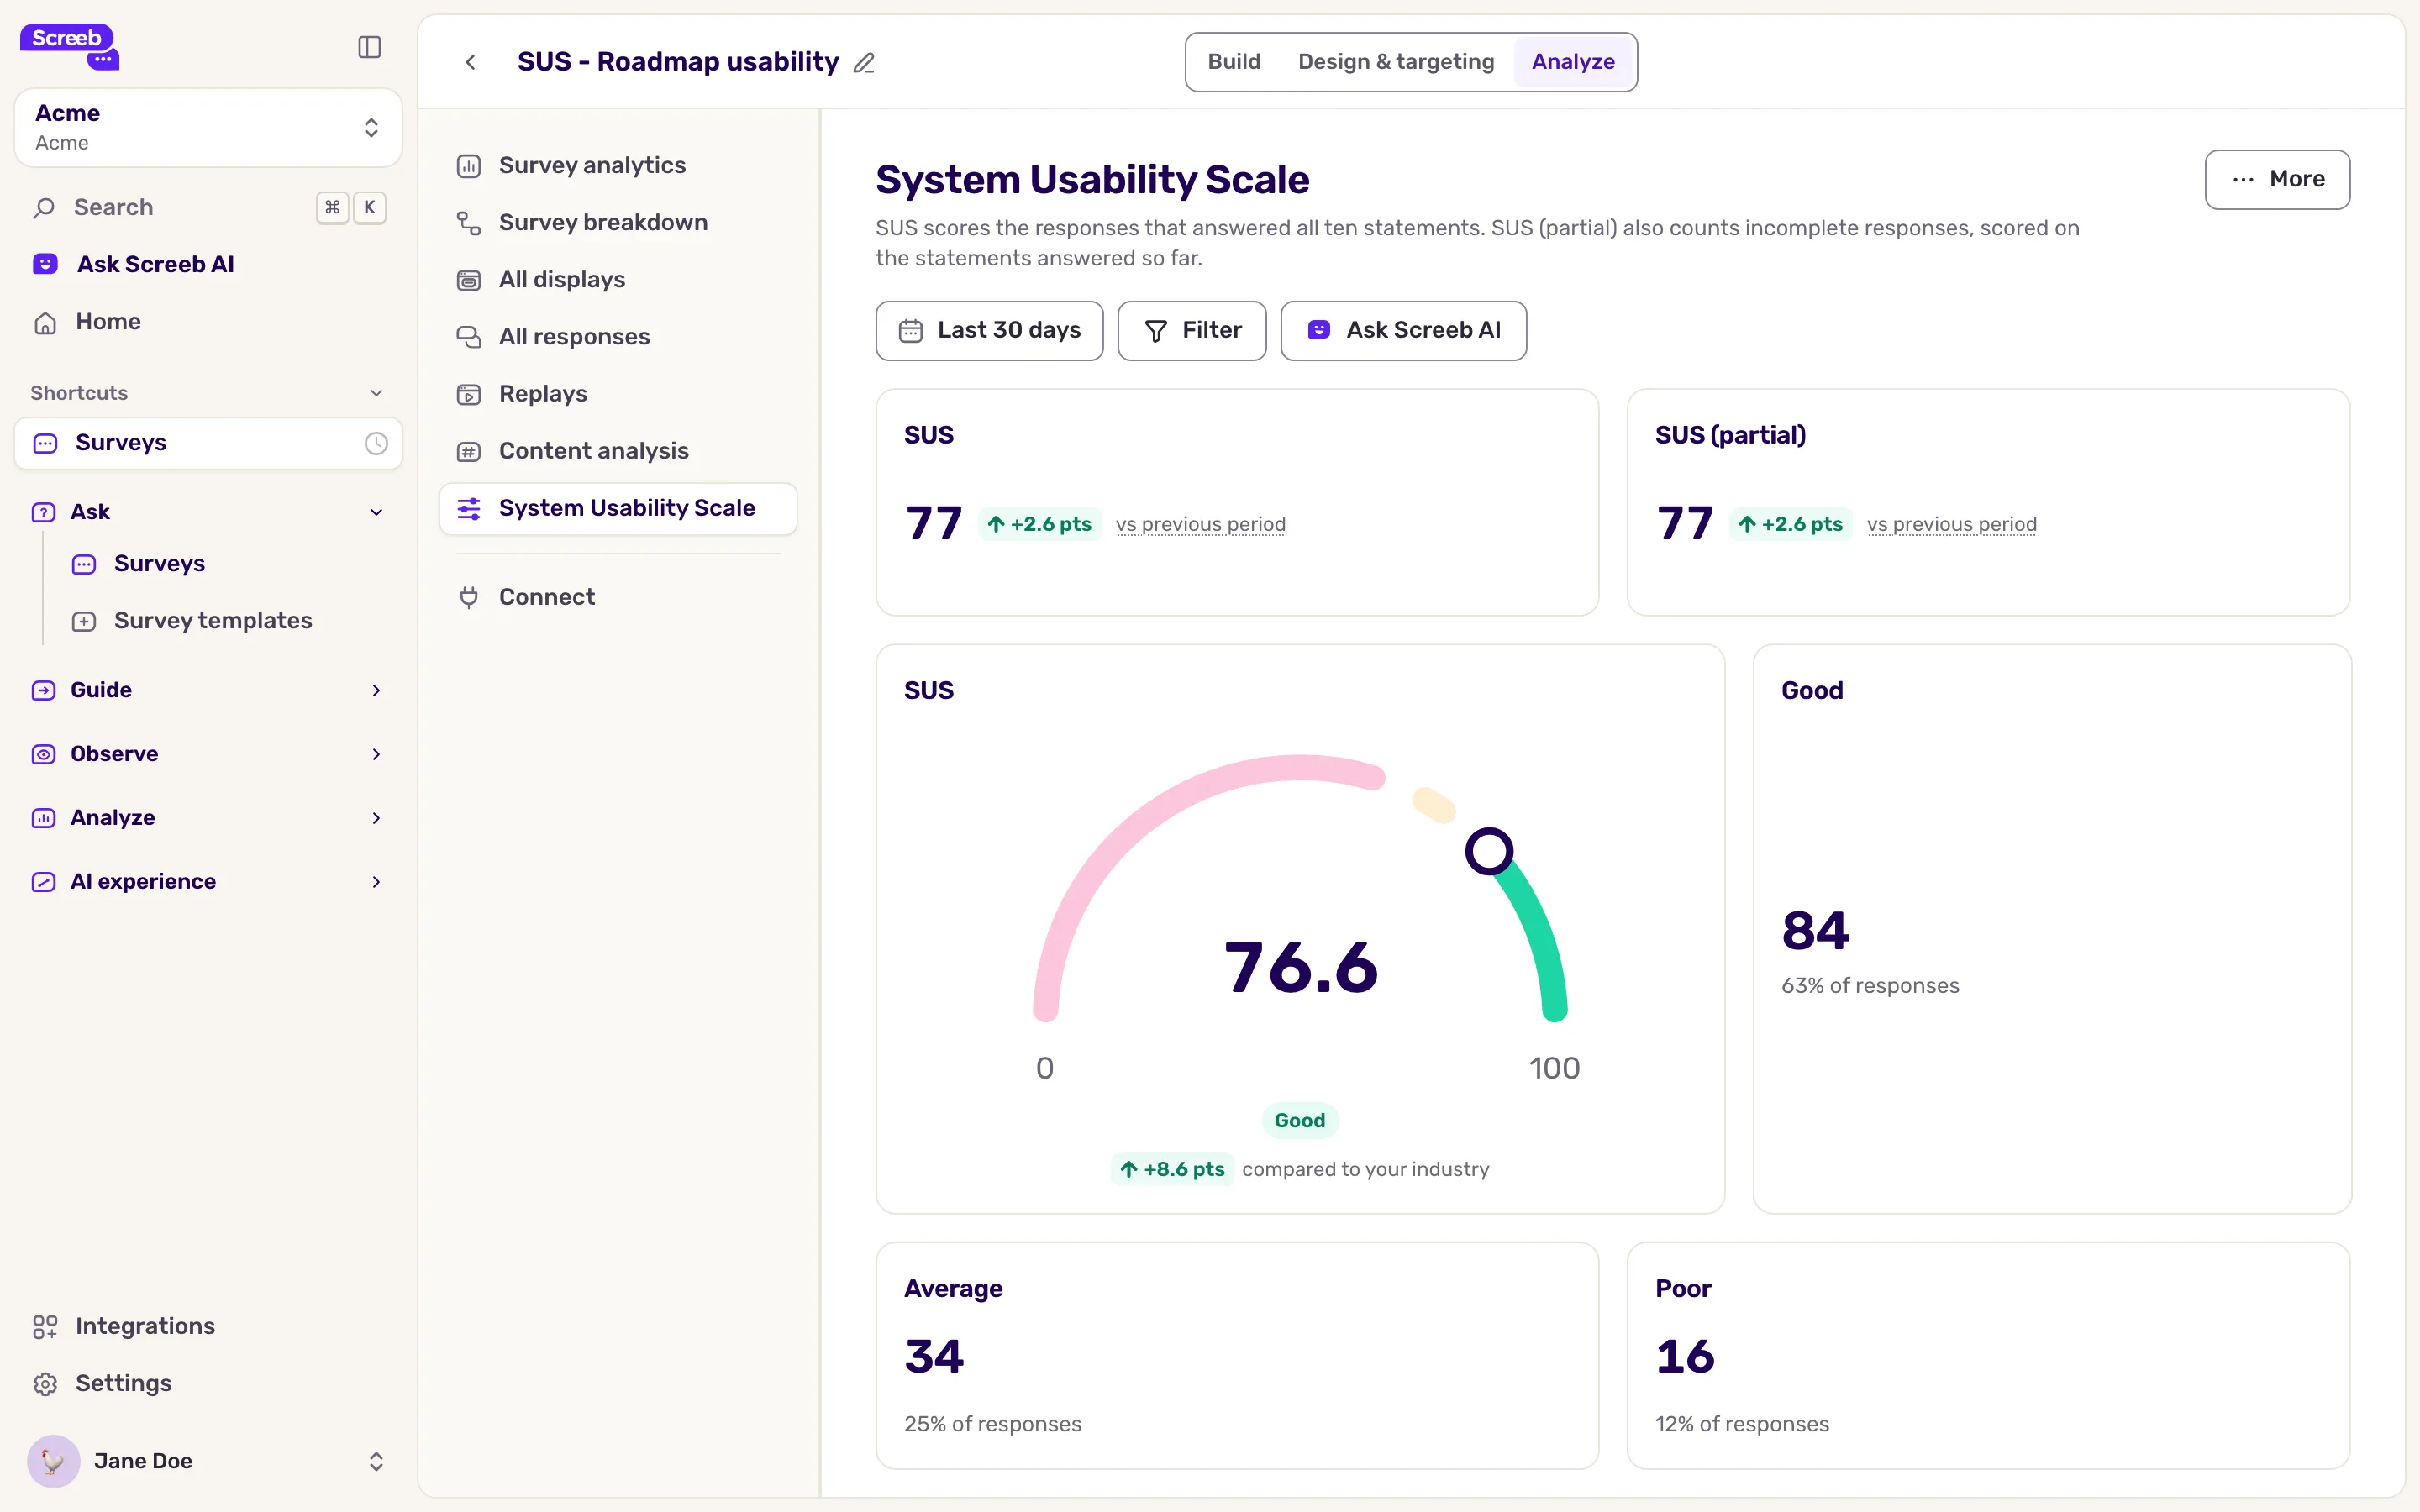
The answers to the question. In All responses, the Key result column of the SUS question shows the score. Expand the question to see, statement by statement, how users answered, and the SUS and the SUS (partial) of the question.
Reports and formulas. You can add SUS and SUS (partial) widgets to your workspace reports and home page, for one survey or several, and use them as variables of a formula. See Build workspace and organization reports.
Limits
Section titled “Limits”- The SUS works wherever the Likert question works: in your site or app, on a link, embedded, and in the iOS and Android apps. In an email survey, users answer it in their browser, like a Likert question.
- Use one SUS question per survey. If a survey has several, their answers are counted together in its report.
- The score is computed as users answer. It is not recomputed for responses collected before you added the SUS question, and it is not available for responses imported from a CSV file.
- The SUS has no industry benchmark in Screeb yet, it is not part of the scheduled report KPIs, and the Score column of the survey list does not show it.
- The SUS says how usable the product feels, not why. Add an open question after it to collect the reasons, see Choosing between NPS, CSAT, CES and NES.