

Measure the results of your messages
Read how many users saw your message, interacted with it and went through every step, find where a product tour loses them, and see who saw it.
Once a message is live, its Analyze pages tell you whether users see it, interact with it and go to the end, and at which step a product tour loses them.
Before you start
Section titled “Before you start”- The message has been live for a while, see Choose who sees your message and when.
- Replays shows only when your plan includes Session Replay. Connect shows only when your role can manage integrations.
Open the results
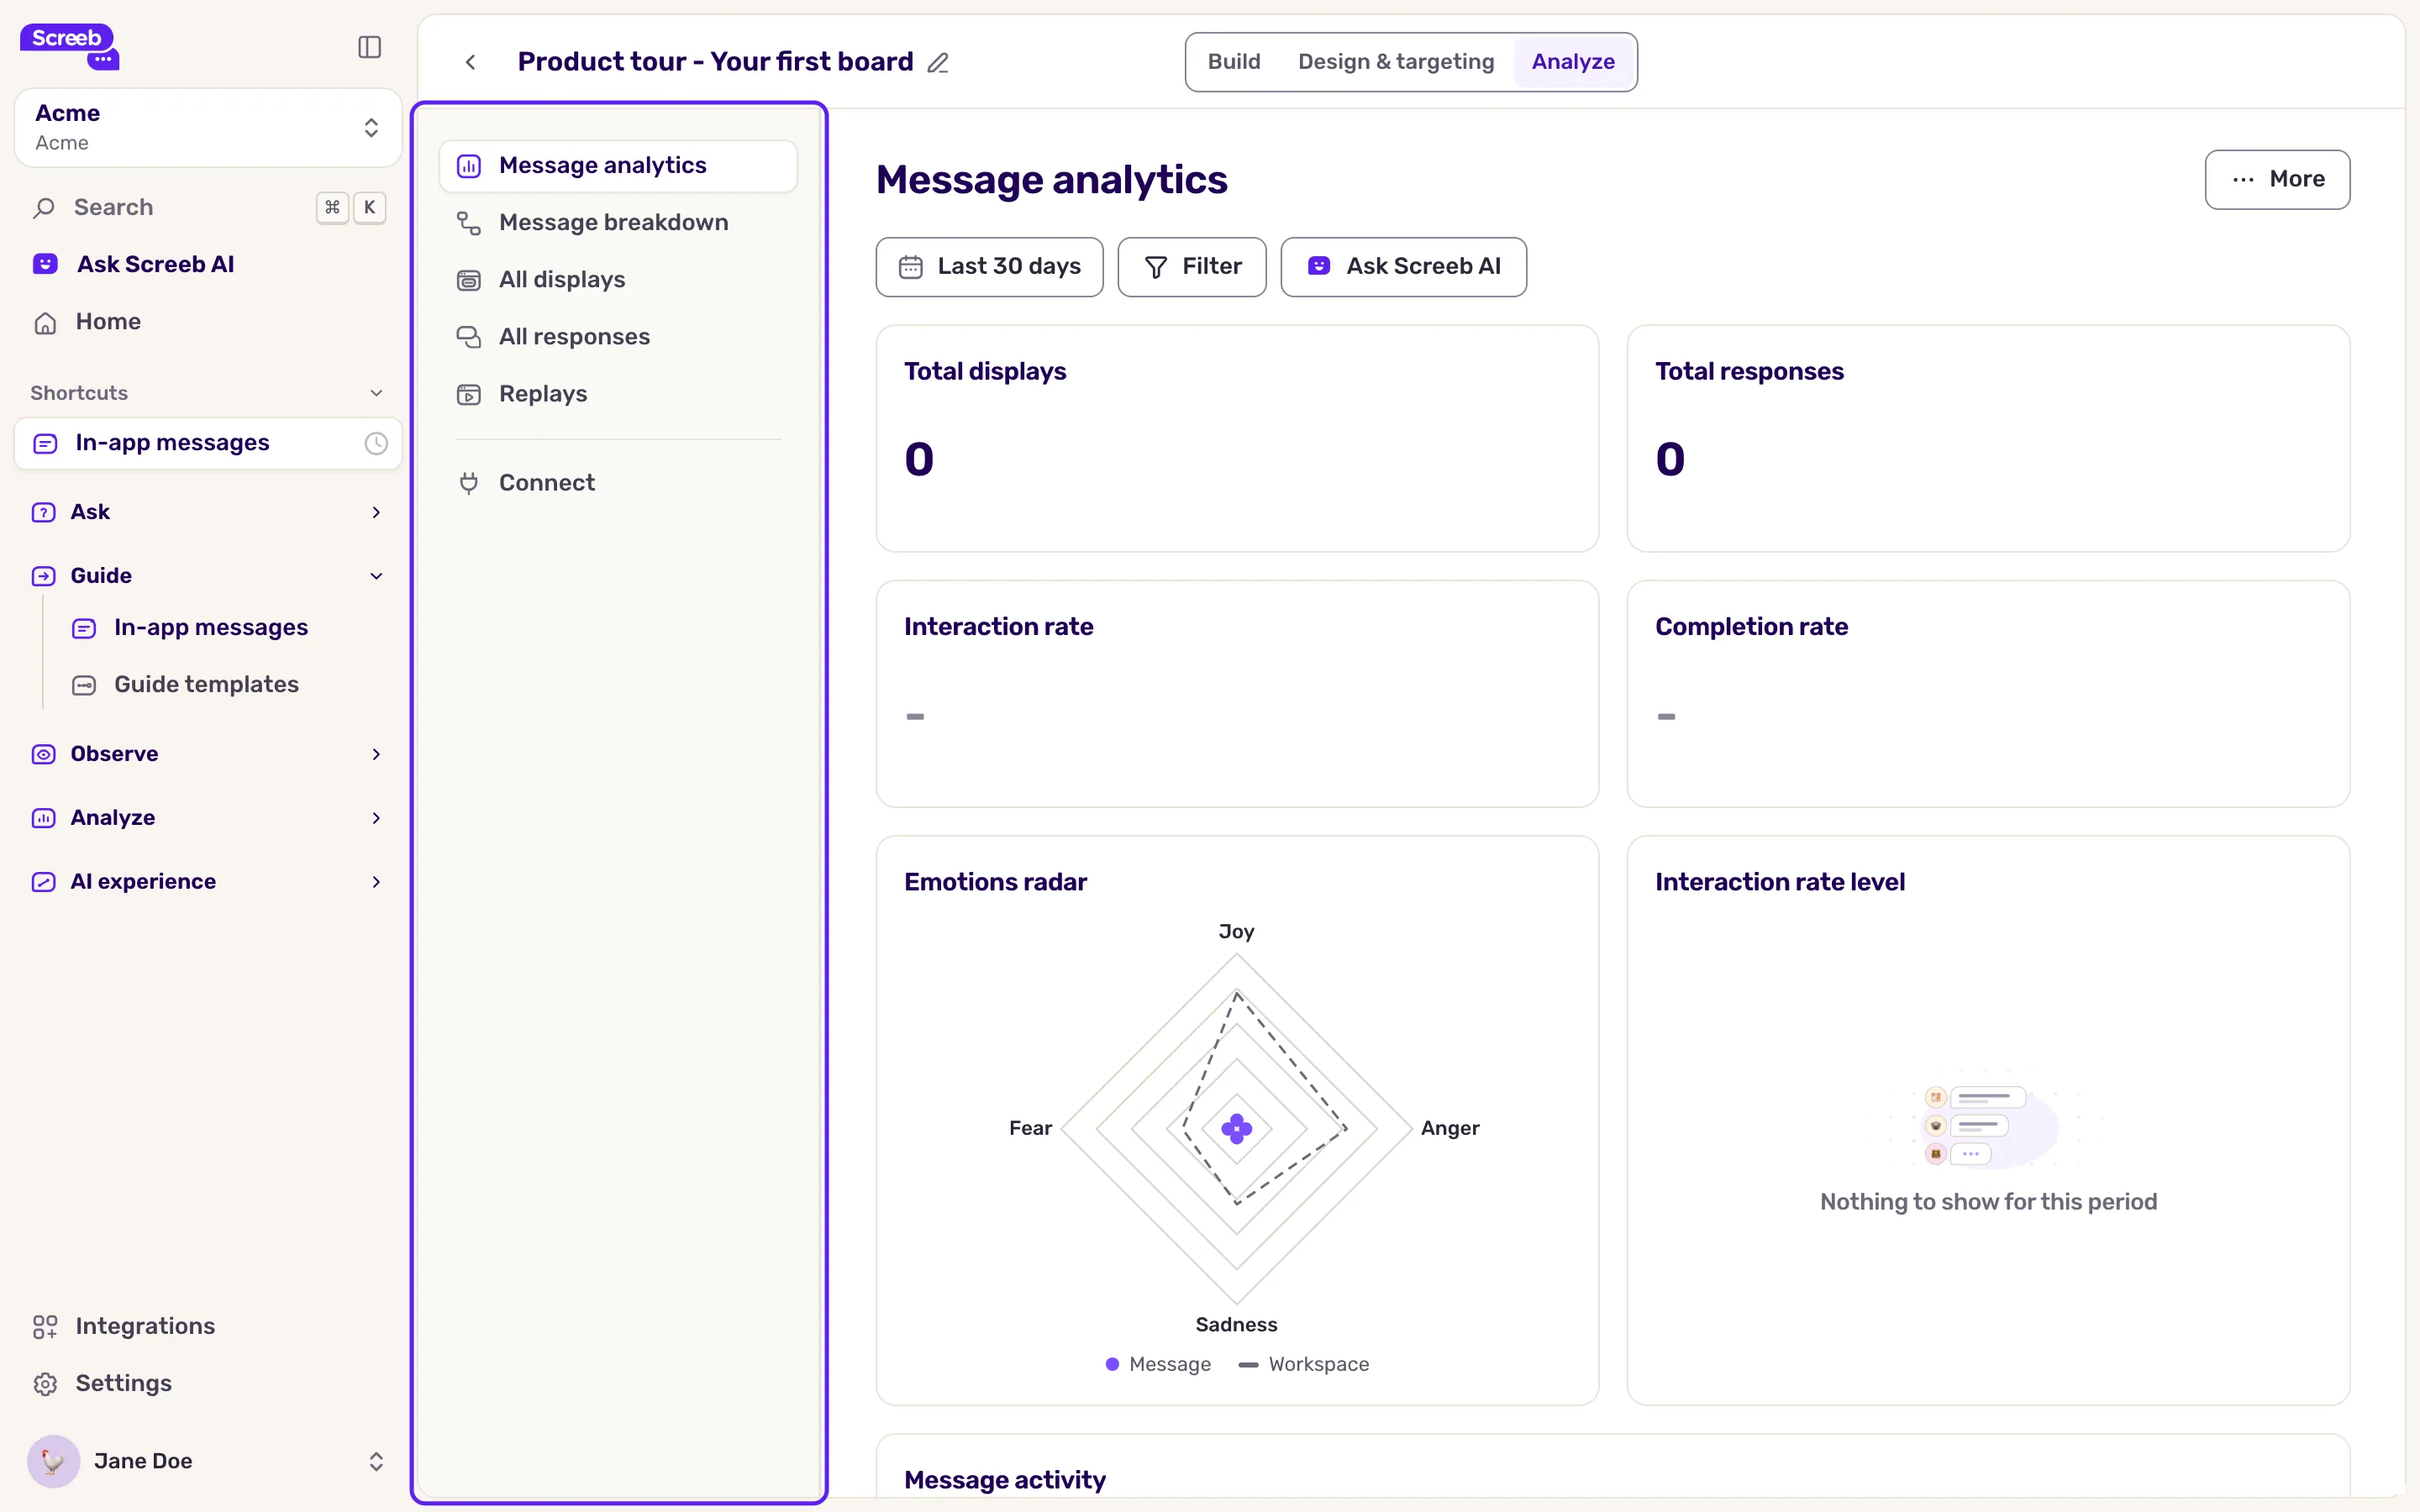
Section titled “Open the results”- Open the message and click Analyze in the header. The Message analytics page opens.
- Pick the period in the date picker at the top. Every page of the side menu uses it.
- To narrow the results to some users, add filters, as for a survey: see Filter survey responses. The period and the filters follow you from page to page.
What the numbers mean
Section titled “What the numbers mean”A message counts a “response” as soon as the user clicks one of its buttons: go to the next step, a choice, a link, a reaction or skip. Closing it does not count.
| Number | What it counts |
|---|---|
| Total displays | How many times the message was shown. |
| Total responses | The displays where the user clicked at least one button, whether they reached the end or not. |
| Interaction rate | Responses divided by displays. |
| Completion rate | Among the responses, the share that went through every step. |
Each number compares with the previous period of the same length. Below them, the page shows by default a Emotions radar, a gauge of the interaction rate, the Displays and responses chart (displays, responses and interaction rate over time) and a Topics list.
Screeb has no “open rate”: a display is a message shown, not a message read. Look at the interaction rate to know whether users engage.
Every teammate of the workspace can add, move and remove the widgets of this page. The layout is shared by every message of the workspace.
The other Analyze pages
Section titled “The other Analyze pages”| Page | What it shows |
|---|---|
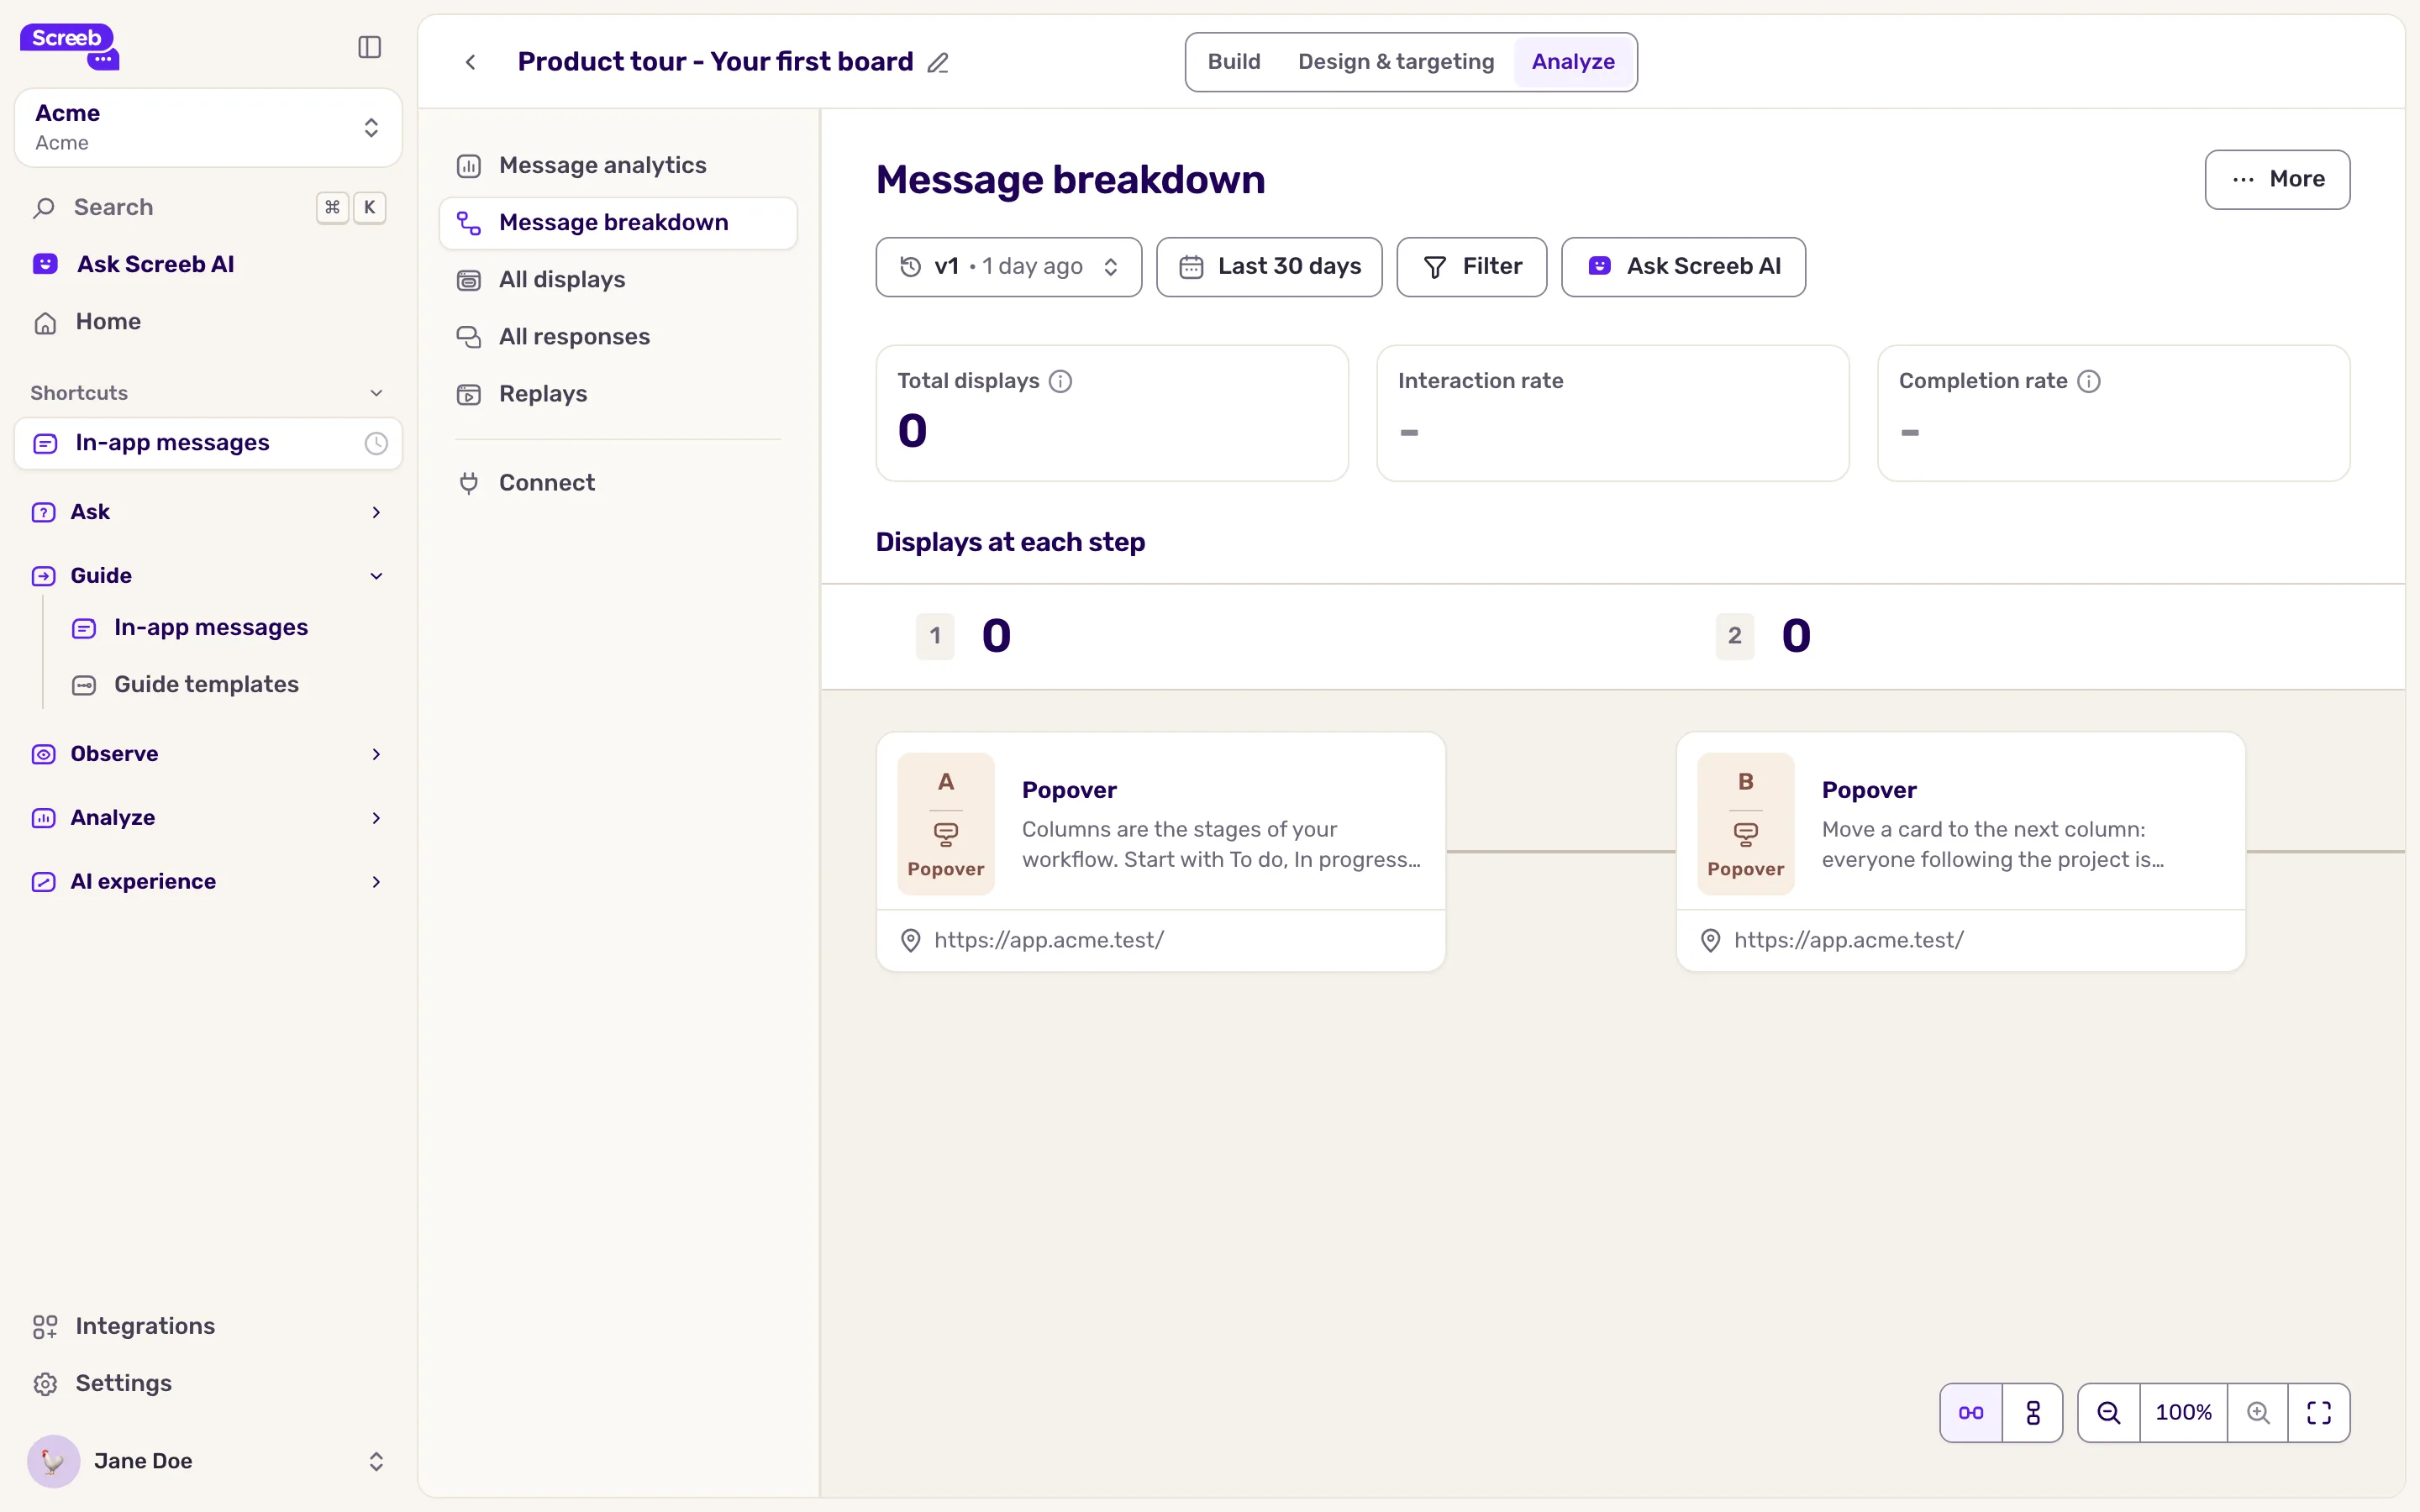
| Message breakdown | How many displays reach each step, to spot where users leave. See below. |
| All displays | Step by step, who saw the message and when. Expand a row for the details of that display and, with Session Replay, Watch session replay. |
| All responses | Step by step, what users clicked: the choice they picked, the reaction they gave. |
| Replays | The session replays of the users who saw the message. |
| Connect | Send the message’s data to a webhook or another tool, see Connect Screeb to your tools. |
If you changed the steps after launch, pick the version of the message in the menu at the top left of the breakdown and display pages.
Find where a product tour loses users
Section titled “Find where a product tour loses users”- In the side menu, click Message breakdown.
- Read the three numbers at the top: Total displays, the interaction rate and the completion rate. The hint of the completion rate also gives it against all displays.
- Below, under Displays at each step, each step shows how many displays reached it, including the ones left without interaction, and an arrow gives the share that went on to the next step. Green is 60% or more, orange 40% or more, red below.
- Look for the red arrow: that step is where users stop.
Read the results right
Section titled “Read the results right”- Check the displays first. Few displays point at the targeting or the step conditions, not at the content. See My survey or message is not displayed.
- Compare with your other messages, not with an absolute target: an onboarding tour and a feature announcement do not reach the same rates.
- Wait for enough displays before you judge a rate. A handful of users moves it a lot.
- Fix the step with the biggest drop. It is often too long, shown at the wrong time, or asks for something the user is not ready to do.
- Measure the outcome. A message works when users then do what it was built for. Track that action with an event, and compare users who completed the message with users who did not see it, for example with a funnel, see Build and read funnels. Sampled-out users are not recorded, so they cannot serve as that comparison group.
- Ask for the why. A Reaction or Choices block at the end of a tour tells you how users felt about it. Read the answers in All responses.
What you get
Section titled “What you get”A view of how far users go in your message, where they stop and who they are, for the period and the users you chose.