

Build workspace and organization reports
Create a report, add score, response, topic or event widgets, and share the same view with your team, for one workspace or the whole organization.
A report is a dashboard you build from widgets: scores, response counts, topics, event measures and notes, side by side. Workspace reports read one workspace; organization reports can compare several.
Before you start
Section titled “Before you start”- Every teammate can open and create workspace reports. A workspace report is edited, renamed and deleted by its author or an organization admin; any teammate can duplicate it.
- Creating, editing and deleting organization reports needs the admin role of the organization.
- Organization reports are in the organization view, see Find your way around Screeb.
Create a report
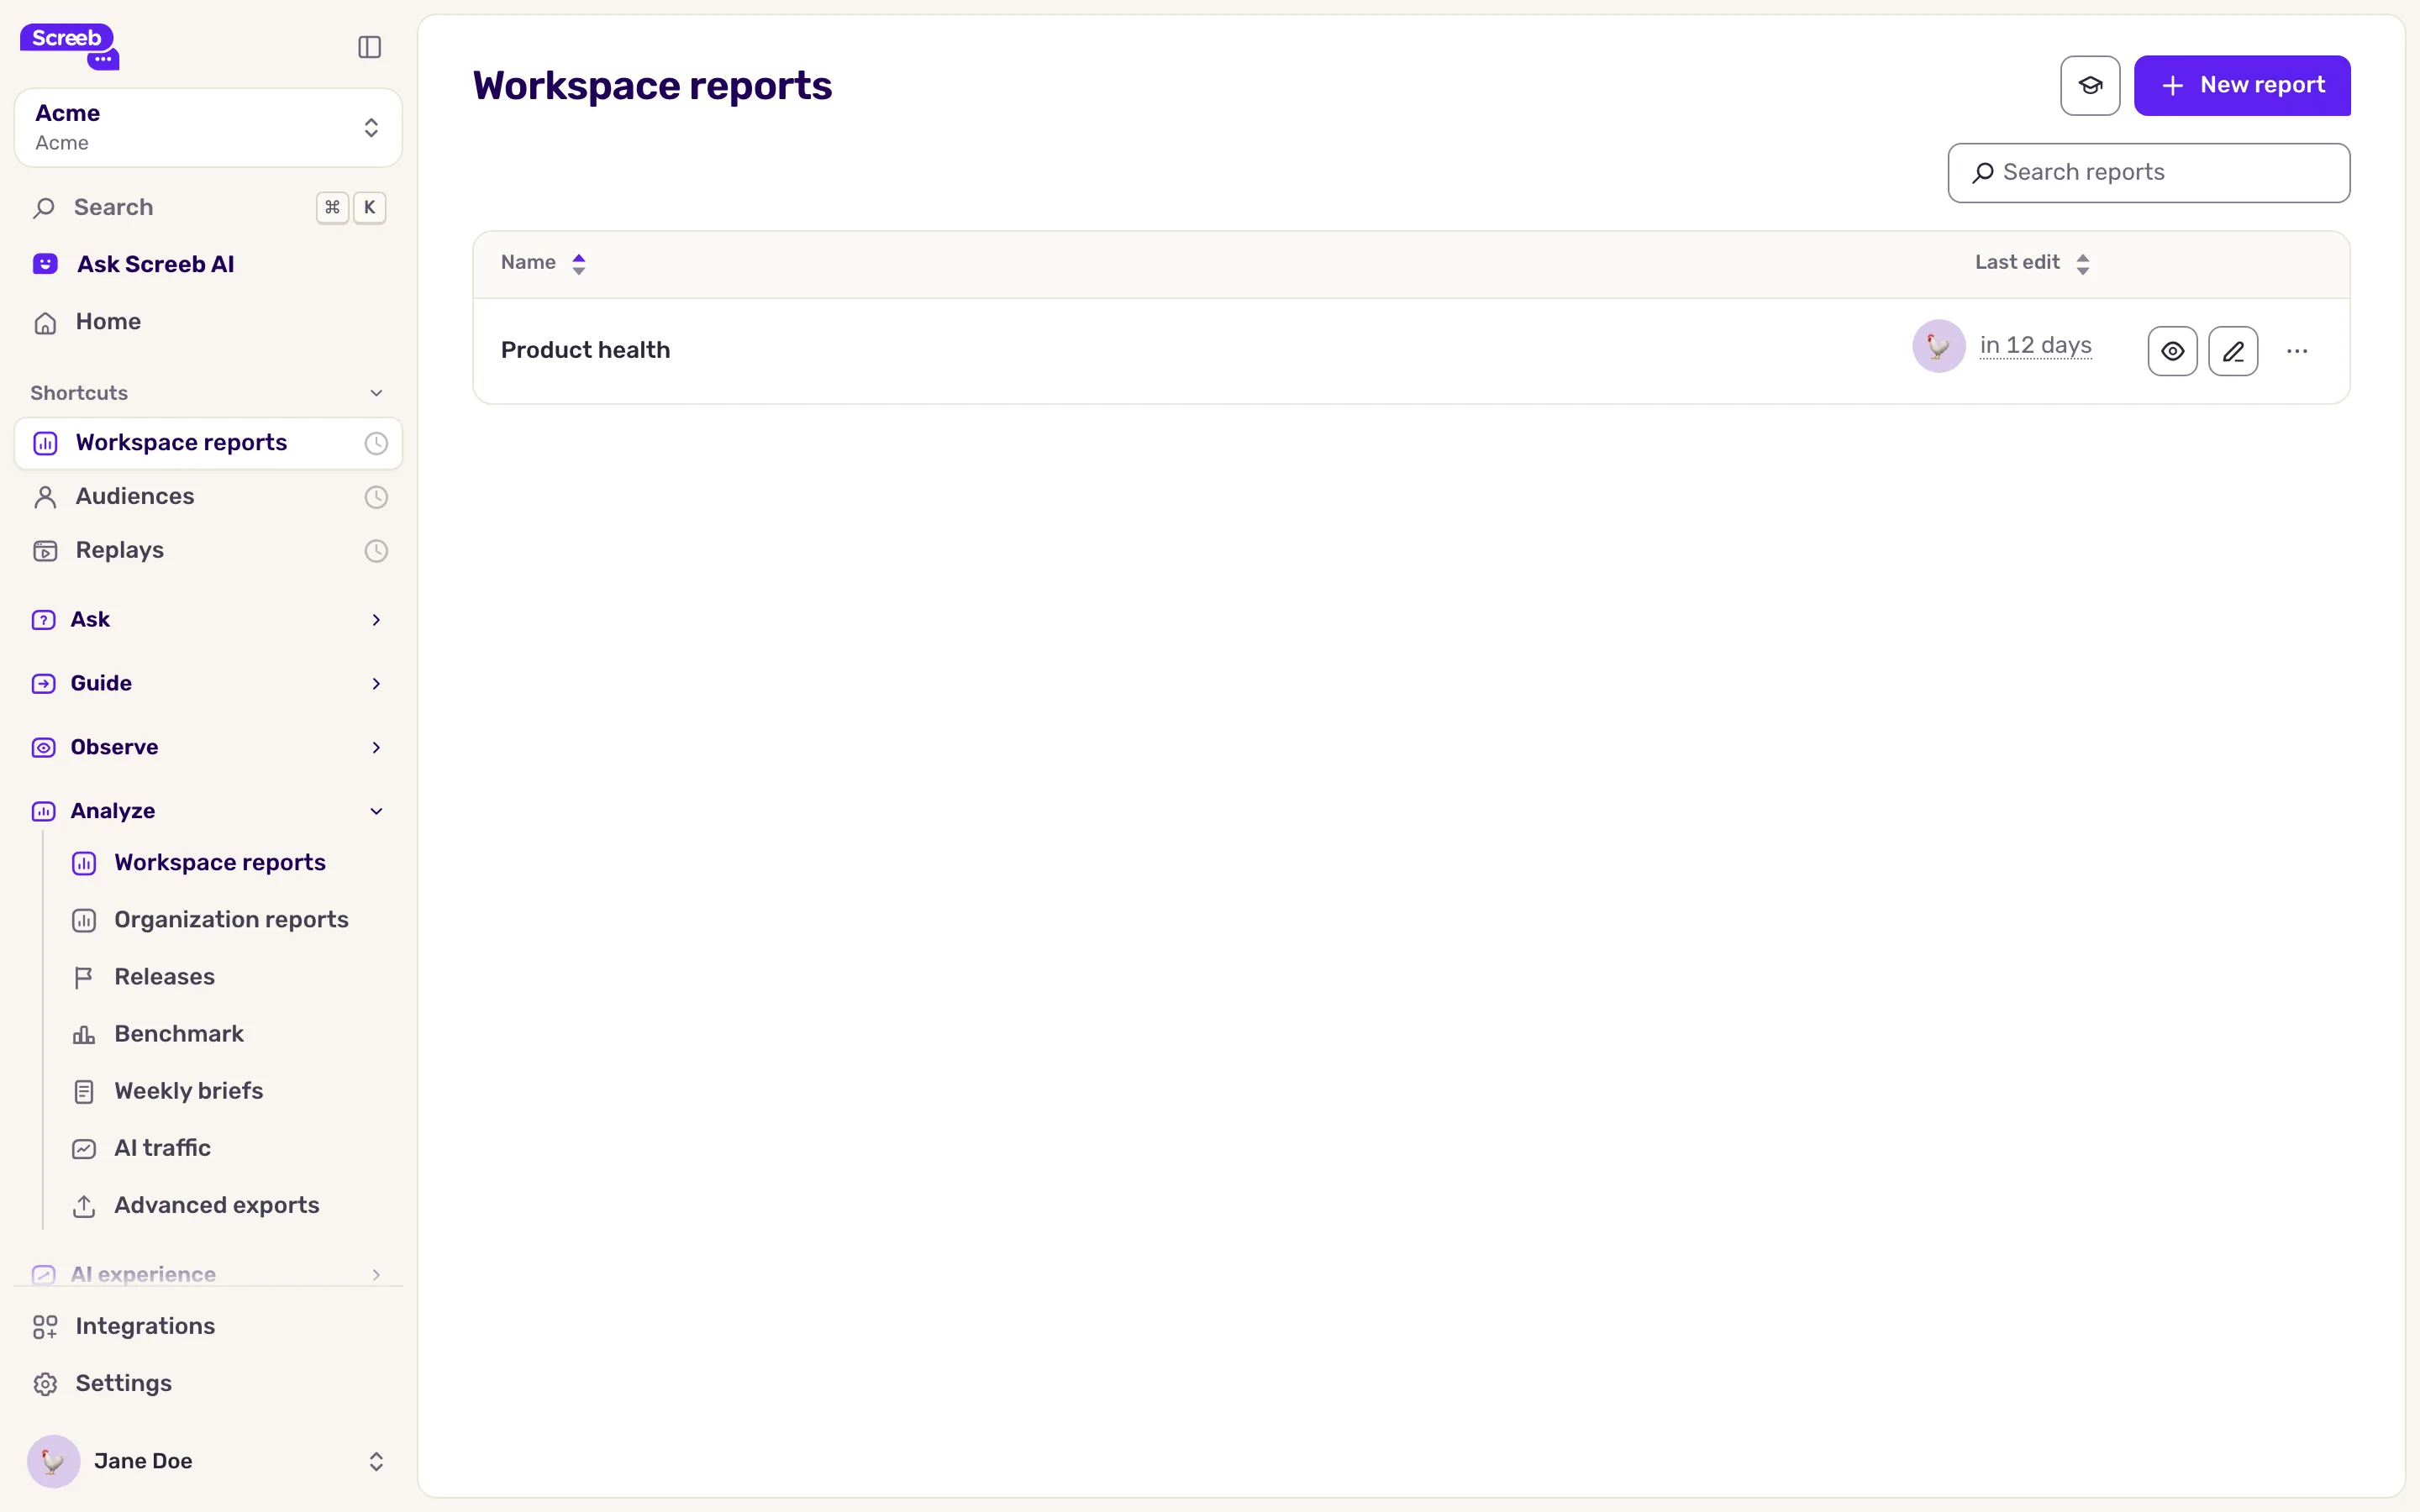
Section titled “Create a report”- In the sidebar, under Analyze, click Workspace reports. For the organization, open Organization reports instead.
- Click New report.
- Enter a Name and click Create. A workspace report opens, empty. An organization report is added to the list: click its name to open it.
Add a widget
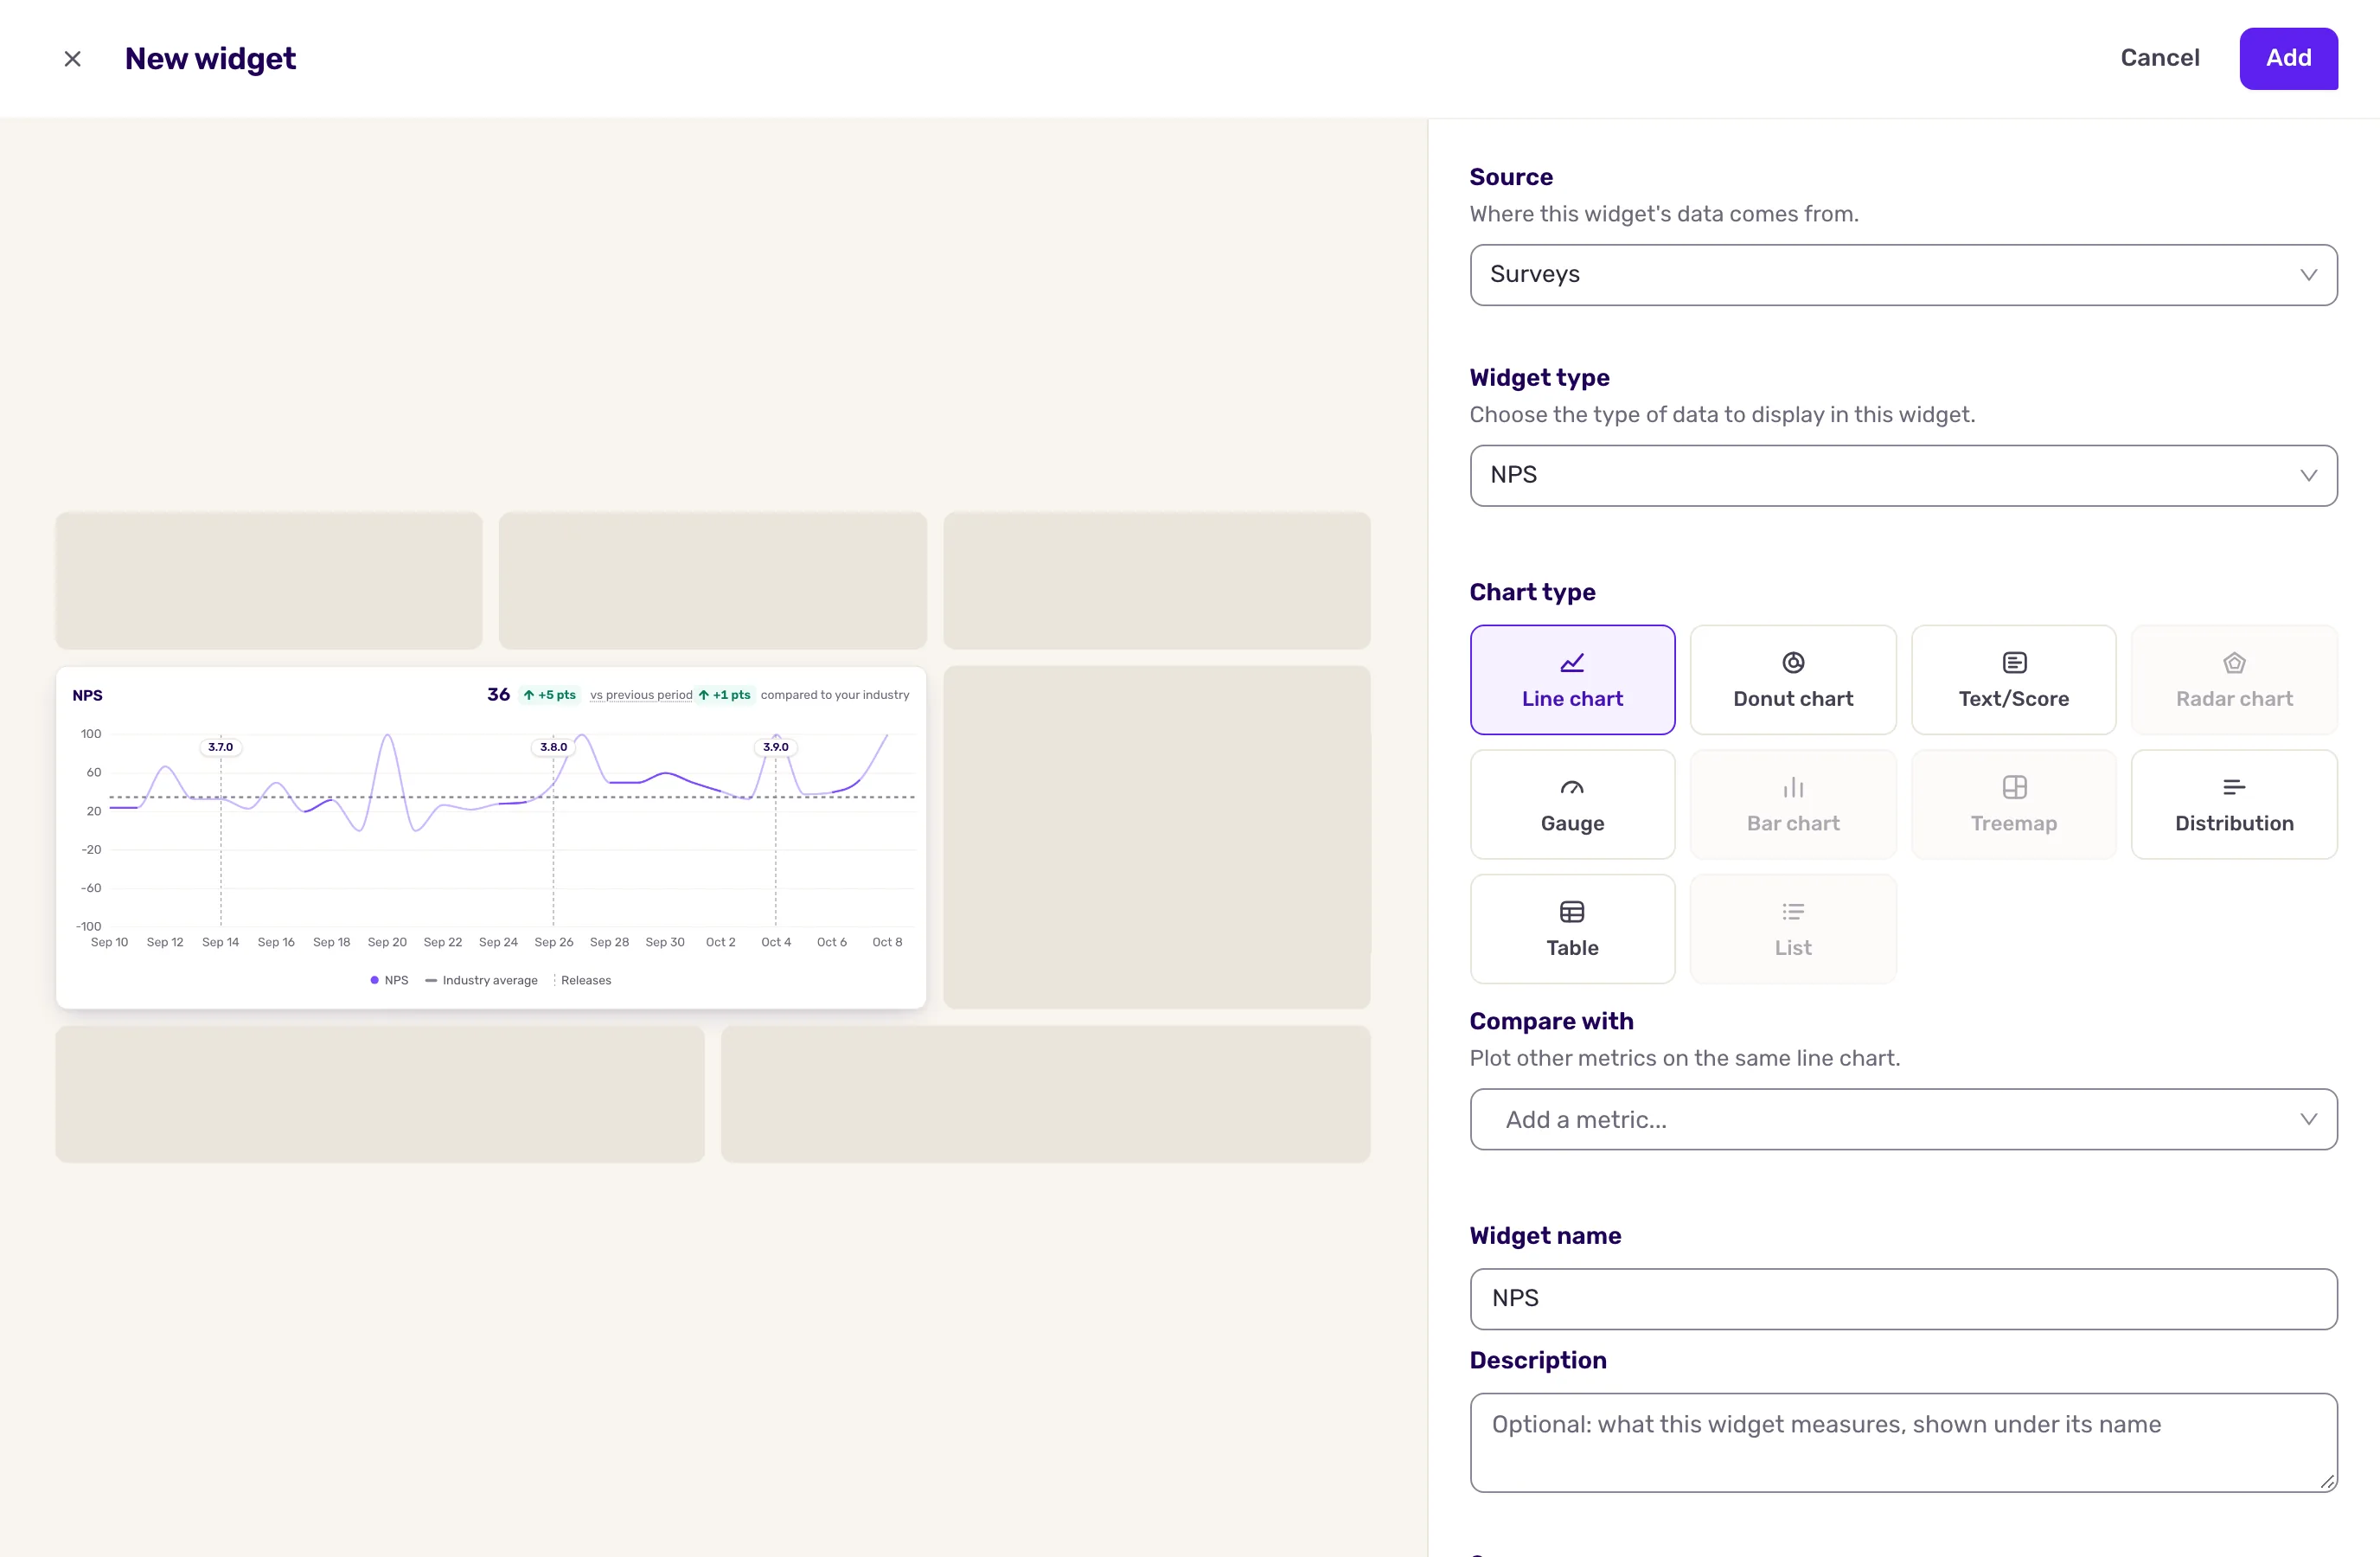
Section titled “Add a widget”- In the report, click Add widget. In a workspace report, the button is at the top right. An organization report shows it only while it is empty: once it has widgets, add one from the edit mode, see Customize a report layout. The New widget panel opens, with a live preview.
- Pick the Source of the data: surveys, events, page views, screens or session replays. For surveys, keep every survey or select some.
- Pick the Widget type: the metric to show. The list depends on the source.
- Pick the Chart type, such as a line, a bar chart, a donut, a gauge, a single number or a table. Types that do not fit the metric are greyed out. For a list, turn on Show row details to show each row’s details without a click.
- Optional: change the Widget name, and add rules under Filters that apply to this widget only: the preview follows each rule once it is complete. In an organization report, choose the Workspaces to read.
- Click Add (Apply when you edit a widget). The widget appears in the report, and the report enters the edit mode: save it for the team, see Customize a report layout.
The main widget types:
| Widget type | Shows |
|---|---|
| NPS, CSAT, CES | The score of your surveys, as a number, a gauge or a trend. See How Screeb calculates NPS. A trend shows your releases, see Track your releases. |
| Number of responses, Response rate | How many people answered, and the share of displays that got an answer. |
| Sentiment, Topics | The tone of written answers, and the topics they mention. |
| Quote of the day | A recent written answer. |
| Measure, Funnel | A count or an average on events, page views or screens, and the conversion between steps. |
Read a report
Section titled “Read a report”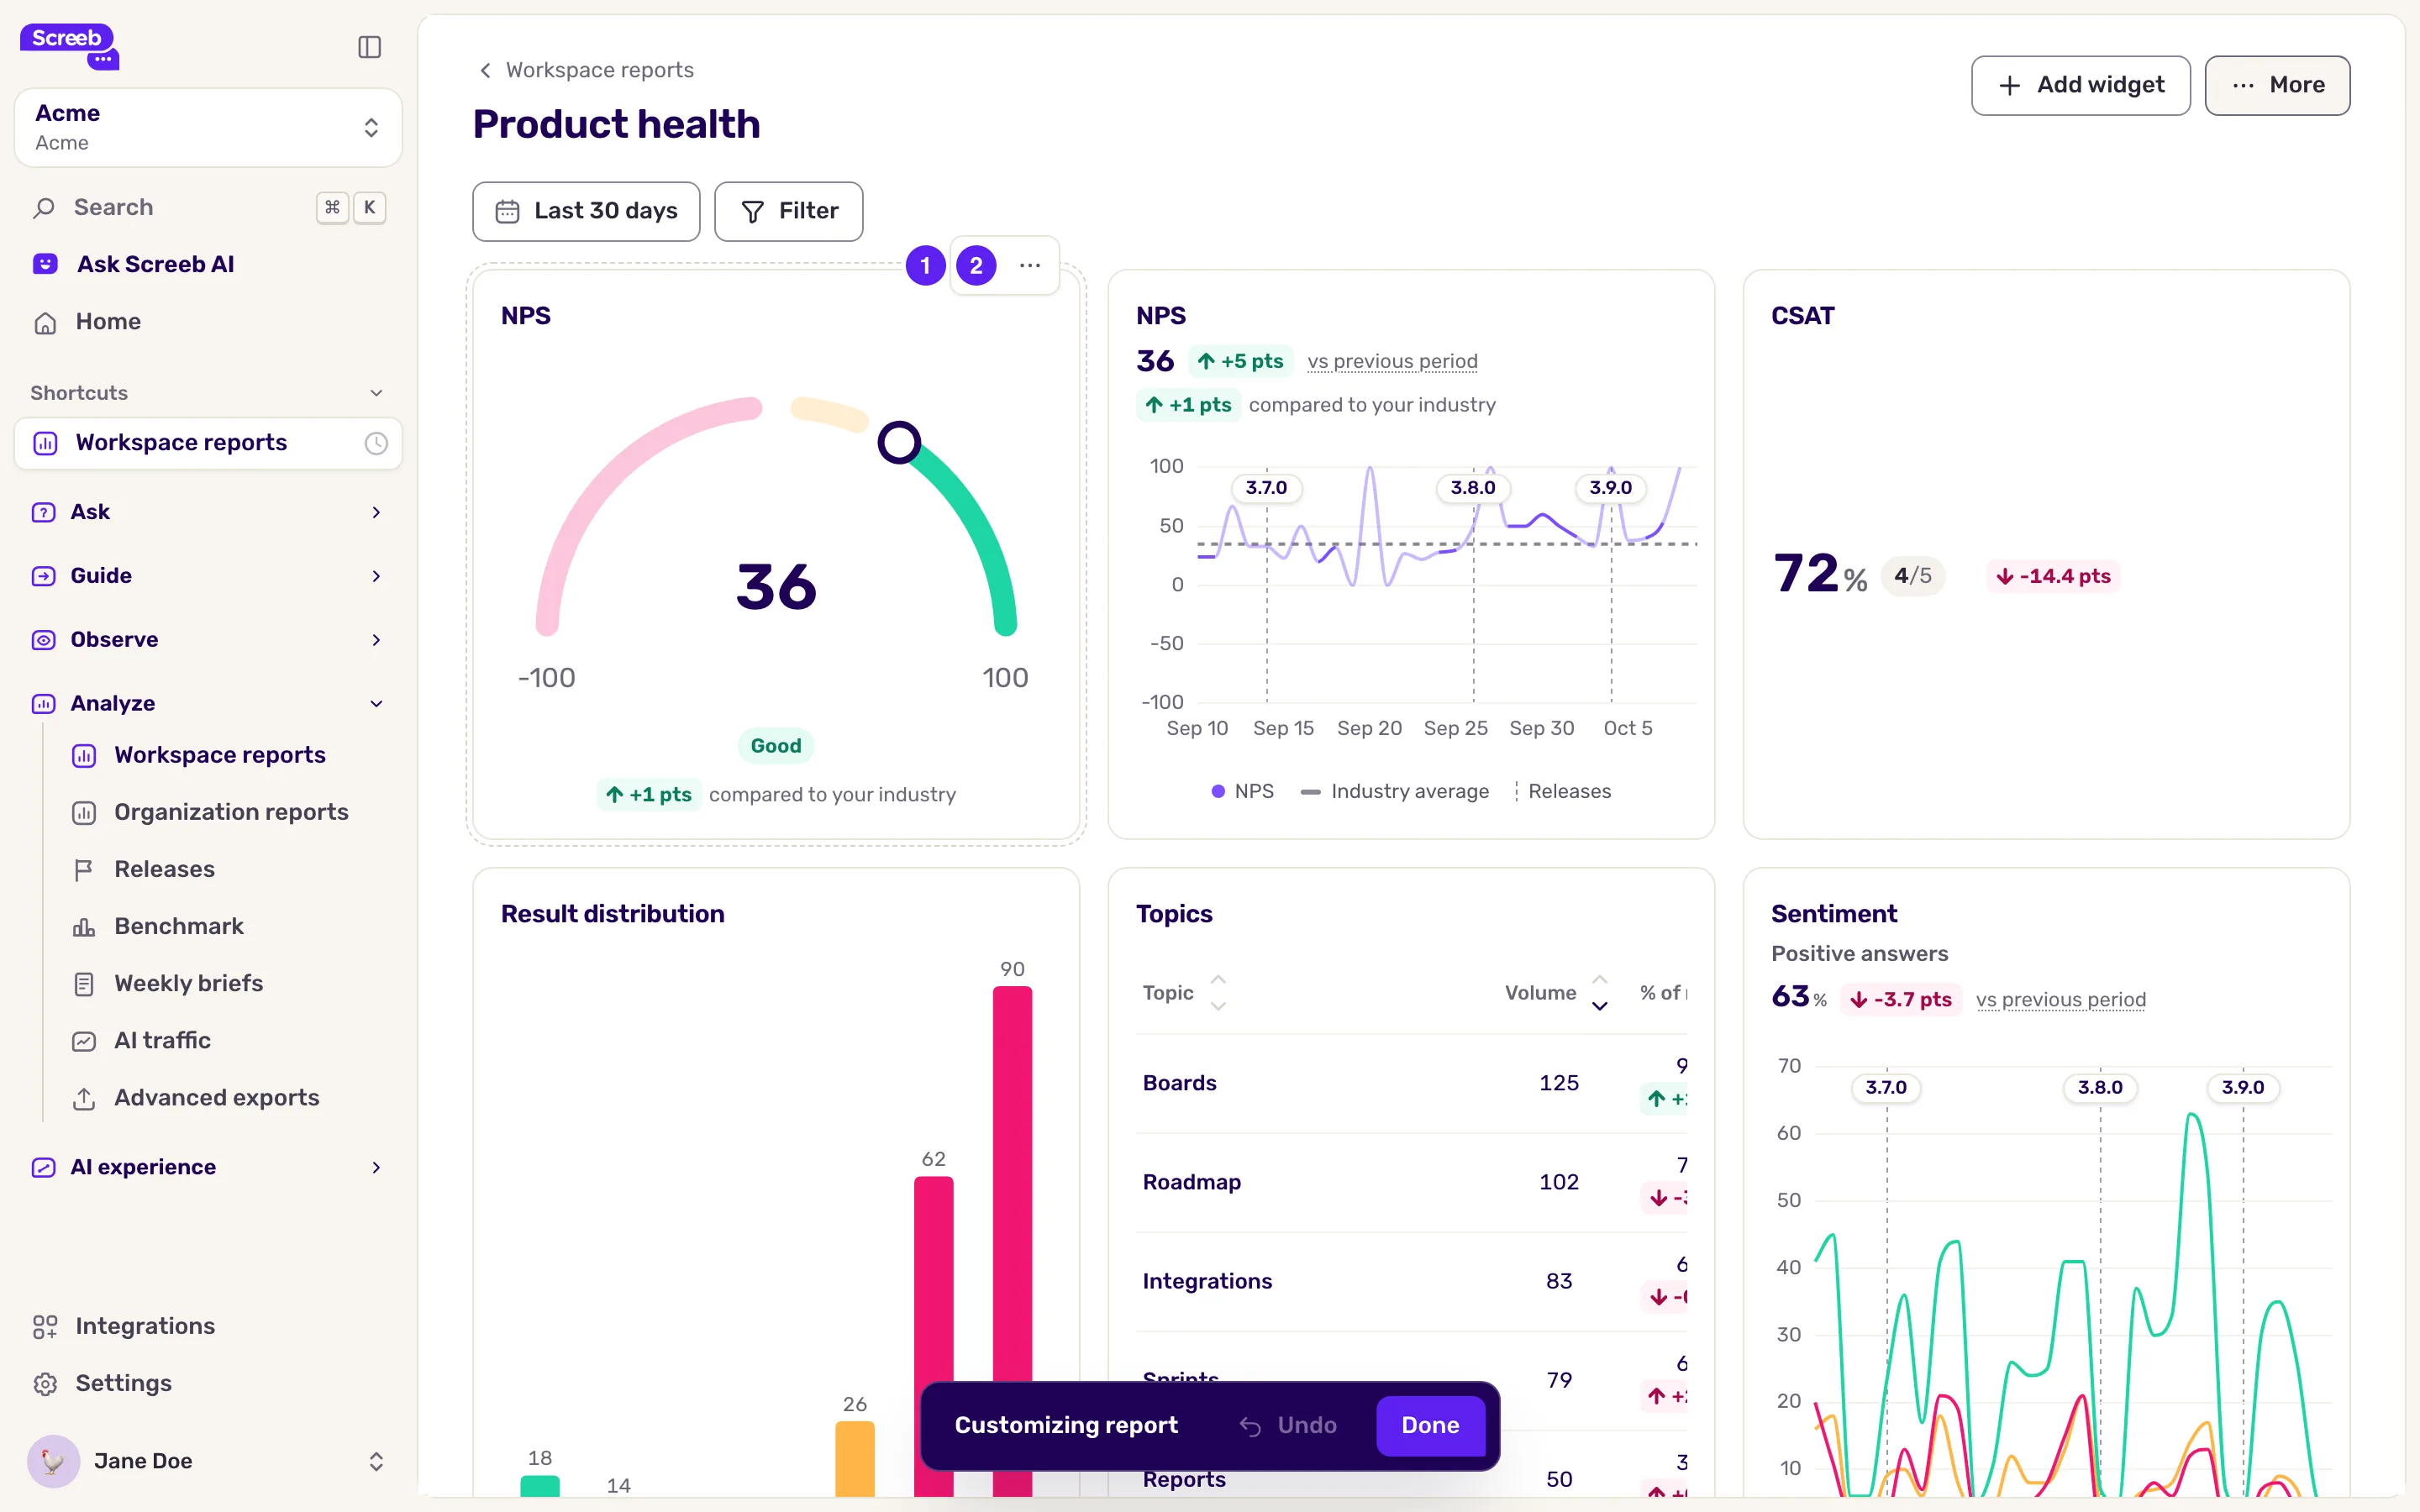
At the top of the report, pick the period and compare it with the previous one. Without a period in the page address, a report opens on the last period you picked in this workspace (the last 30 days at first). In a workspace report, add filters on users, events or responses: they apply to every widget, on top of each widget’s own filters.
The period and filters stay in the page address and are not saved with the report. Copy the address to share the exact view.
What you get
Section titled “What you get”A dashboard that every teammate opens from the same place, with the metrics you chose, for the period each reader picks.
Troubleshooting
Section titled “Troubleshooting”Add widget does not show. In an organization report with widgets, open the More menu, click Customize report and add the widget from the layout. If you cannot edit the report at all, someone else created this workspace report, or your role does not allow editing organization reports. Duplicate the report to edit your own copy, or ask an organization admin.
A widget is empty. No data matches its source and filters over the period. Widen the period, or check the widget’s filters with Edit.