

Choosing between NPS, CSAT, CES, NES and SUS
Learn what NPS, CSAT, CES, NES and SUS each measure, when to ask them, and how to avoid the timing mistakes that skew your scores.
NPS, CSAT, CES, NES and SUS are the five scores of the Scores group of the builder. Each one answers a different question, and each one is only reliable when you ask it at the right moment. Asked too early, too late or too often, a score measures fatigue or confusion instead of your product.
At a glance
Section titled “At a glance”| Score | Measures | Scale | When to ask | Score shown |
|---|---|---|---|---|
| NPS (Net Promoter Score) | Loyalty to your product as a whole | 0 to 10 | Cold, after real use, then on a regular rhythm | % of promoters minus % of detractors, from -100 to +100 |
| CSAT (Customer Satisfaction) | Satisfaction with one interaction | 1 to 5 | Hot, right after the interaction | % of answers of 4 or 5 |
| CES (Customer Effort Score) | Effort a task took | 1 to 7, lower is better | Hot, right after the task | Average of the answers |
| NES (Net Easy Score) | Ease of a task, as a net score | 1 to 5 or 1 to 7 | Hot, right after the task | % of easy answers minus % of difficult ones, from -100 to +100 |
| SUS (System Usability Scale) | Perceived usability of a product | Ten statements, each answered on 5 levels | After real use of the product, or after a usability test | Average of the users’ scores, from 0 to 100, where 68 is the average |
NPS: ask cold, then regularly
Section titled “NPS: ask cold, then regularly”NPS measures the relationship a user has with your product, not one interaction. Ask it once users have had time to get real value from the product, typically a few weeks to a few months after onboarding, depending on how fast your product delivers.
Then ask again on a regular rhythm, such as once a quarter: a single NPS tells you little, its trend tells you a lot. Display again in the targeting sets how long before the same user sees the survey again, see Choose who sees your survey.
CSAT: ask hot, right after the interaction
Section titled “CSAT: ask hot, right after the interaction”CSAT measures satisfaction with a specific moment: a purchase, a support answer, the end of a flow. Show it right after that moment, in the same session if you can. The longer you wait, the more the answer drifts from “how did this go” to a vague feeling about your brand.
To show it at that moment, target the survey on the event or the page that ends the interaction, see Show a survey based on events and user properties.
CES and NES: ask hot, right after a task
Section titled “CES and NES: ask hot, right after a task”CES and NES both measure effort on a task, such as setting up an integration or finishing a checkout. Ask them as soon as the task ends, while the friction is still fresh.
They differ in how the score reads:
- CES is an average from 1 to 7 where lower is better. Word the question and its legends so that a low answer means “easy”.
- NES works like NPS: the share of users who found the task easy minus the share who found it difficult. Some teams find it easier to share, because it reads like a percentage, the same way as NPS.
Pick one of the two for a given task and keep it, so your results stay comparable over time.
SUS: ask after real use
Section titled “SUS: ask after real use”SUS measures how usable users find a product as a whole: an app, a back office, a new version. It is a questionnaire of ten fixed statements, scored from 0 to 100 and comparable with published benchmarks. Ask it once users have used the product enough to have an opinion, or right after a usability test, and again after a major change to compare the two versions.
The SUS tells you how usable the product feels, not what to fix: pair it with an open question. See How Screeb calculates SUS.
How it works in Screeb
Section titled “How it works in Screeb”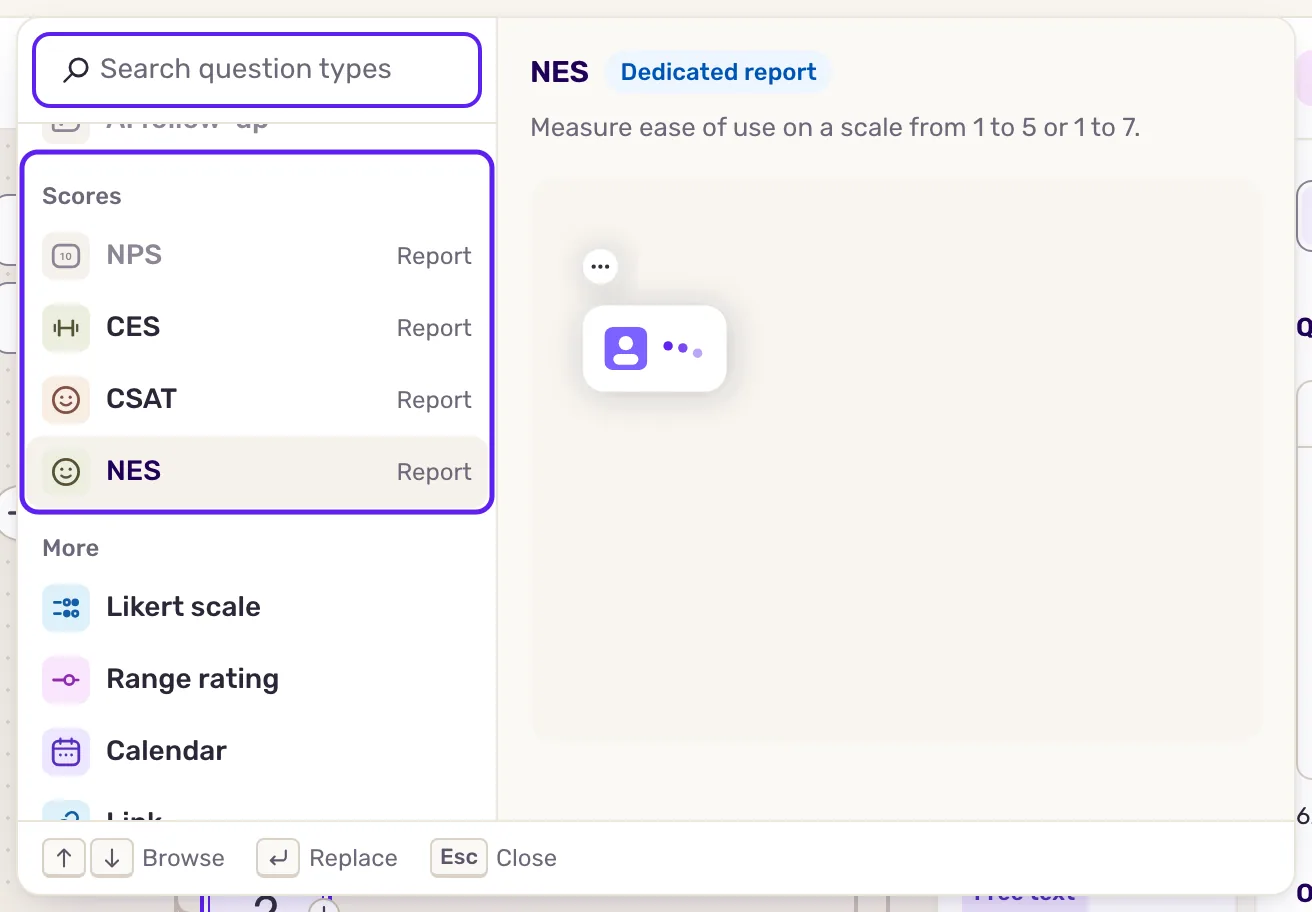
- In the builder, each score is a question type of the Scores group: NPS, CSAT, CES, NES and SUS. The Report tag means the type gets its own report under Analyze.
- Follow every score with a Free text question asking for the reason. The score tells you how much, the answer tells you why.
The most common timing mistakes
Section titled “The most common timing mistakes”- NPS too early. Before users have used the product, the score reflects onboarding friction, not loyalty. It then sets a misleading baseline for every later comparison.
- NPS too often. Asking the same users again and again tires them, and the response rate drops over time. Limit how often surveys show, see Limit how often surveys are displayed.
- CSAT, CES or NES too late. A day later, users no longer remember the detail of the interaction or the task.
Limits
Section titled “Limits”- Only NPS, CSAT, CES, NES and SUS get a score and a report. The answers to Rating, Range rating and Likert scale questions show in the results, without a computed score.
- If a survey has several questions of the same score type, their answers are counted together in its report: use one question per score type and survey to keep it readable.
- The Score column of the survey list shows an NPS, CSAT or CES only, over the last 30 days. Read the NES and the SUS in the survey report.