

Explore topics in your feedback
See which topics your users mention most in their responses, how each one feels and how its share changes over time, then turn them into product priorities.
Topic analysis groups the responses of your users by subject, such as pricing, onboarding or a bug, so you see what they talk about most and how they feel about it, without reading every answer.
Before you start
Section titled “Before you start”- Topics come from the tags on your responses: tags added by hand, tags added when keywords match, and tags the AI adds from the meaning of the answer. Set them up with Topic settings, which opens the Tagging settings, see Tag responses automatically.
- AI features must be available for your workspace: without them, the page is not in the sidebar.
- After you add or change tags, past responses can take some time to show under their new topics.
Open the topic analysis
Section titled “Open the topic analysis”- In the sidebar, under Optimize, click Topic analysis. The Topics view opens.
- Pick the period at the top of the page. Add filters to focus on some responses, users or events.
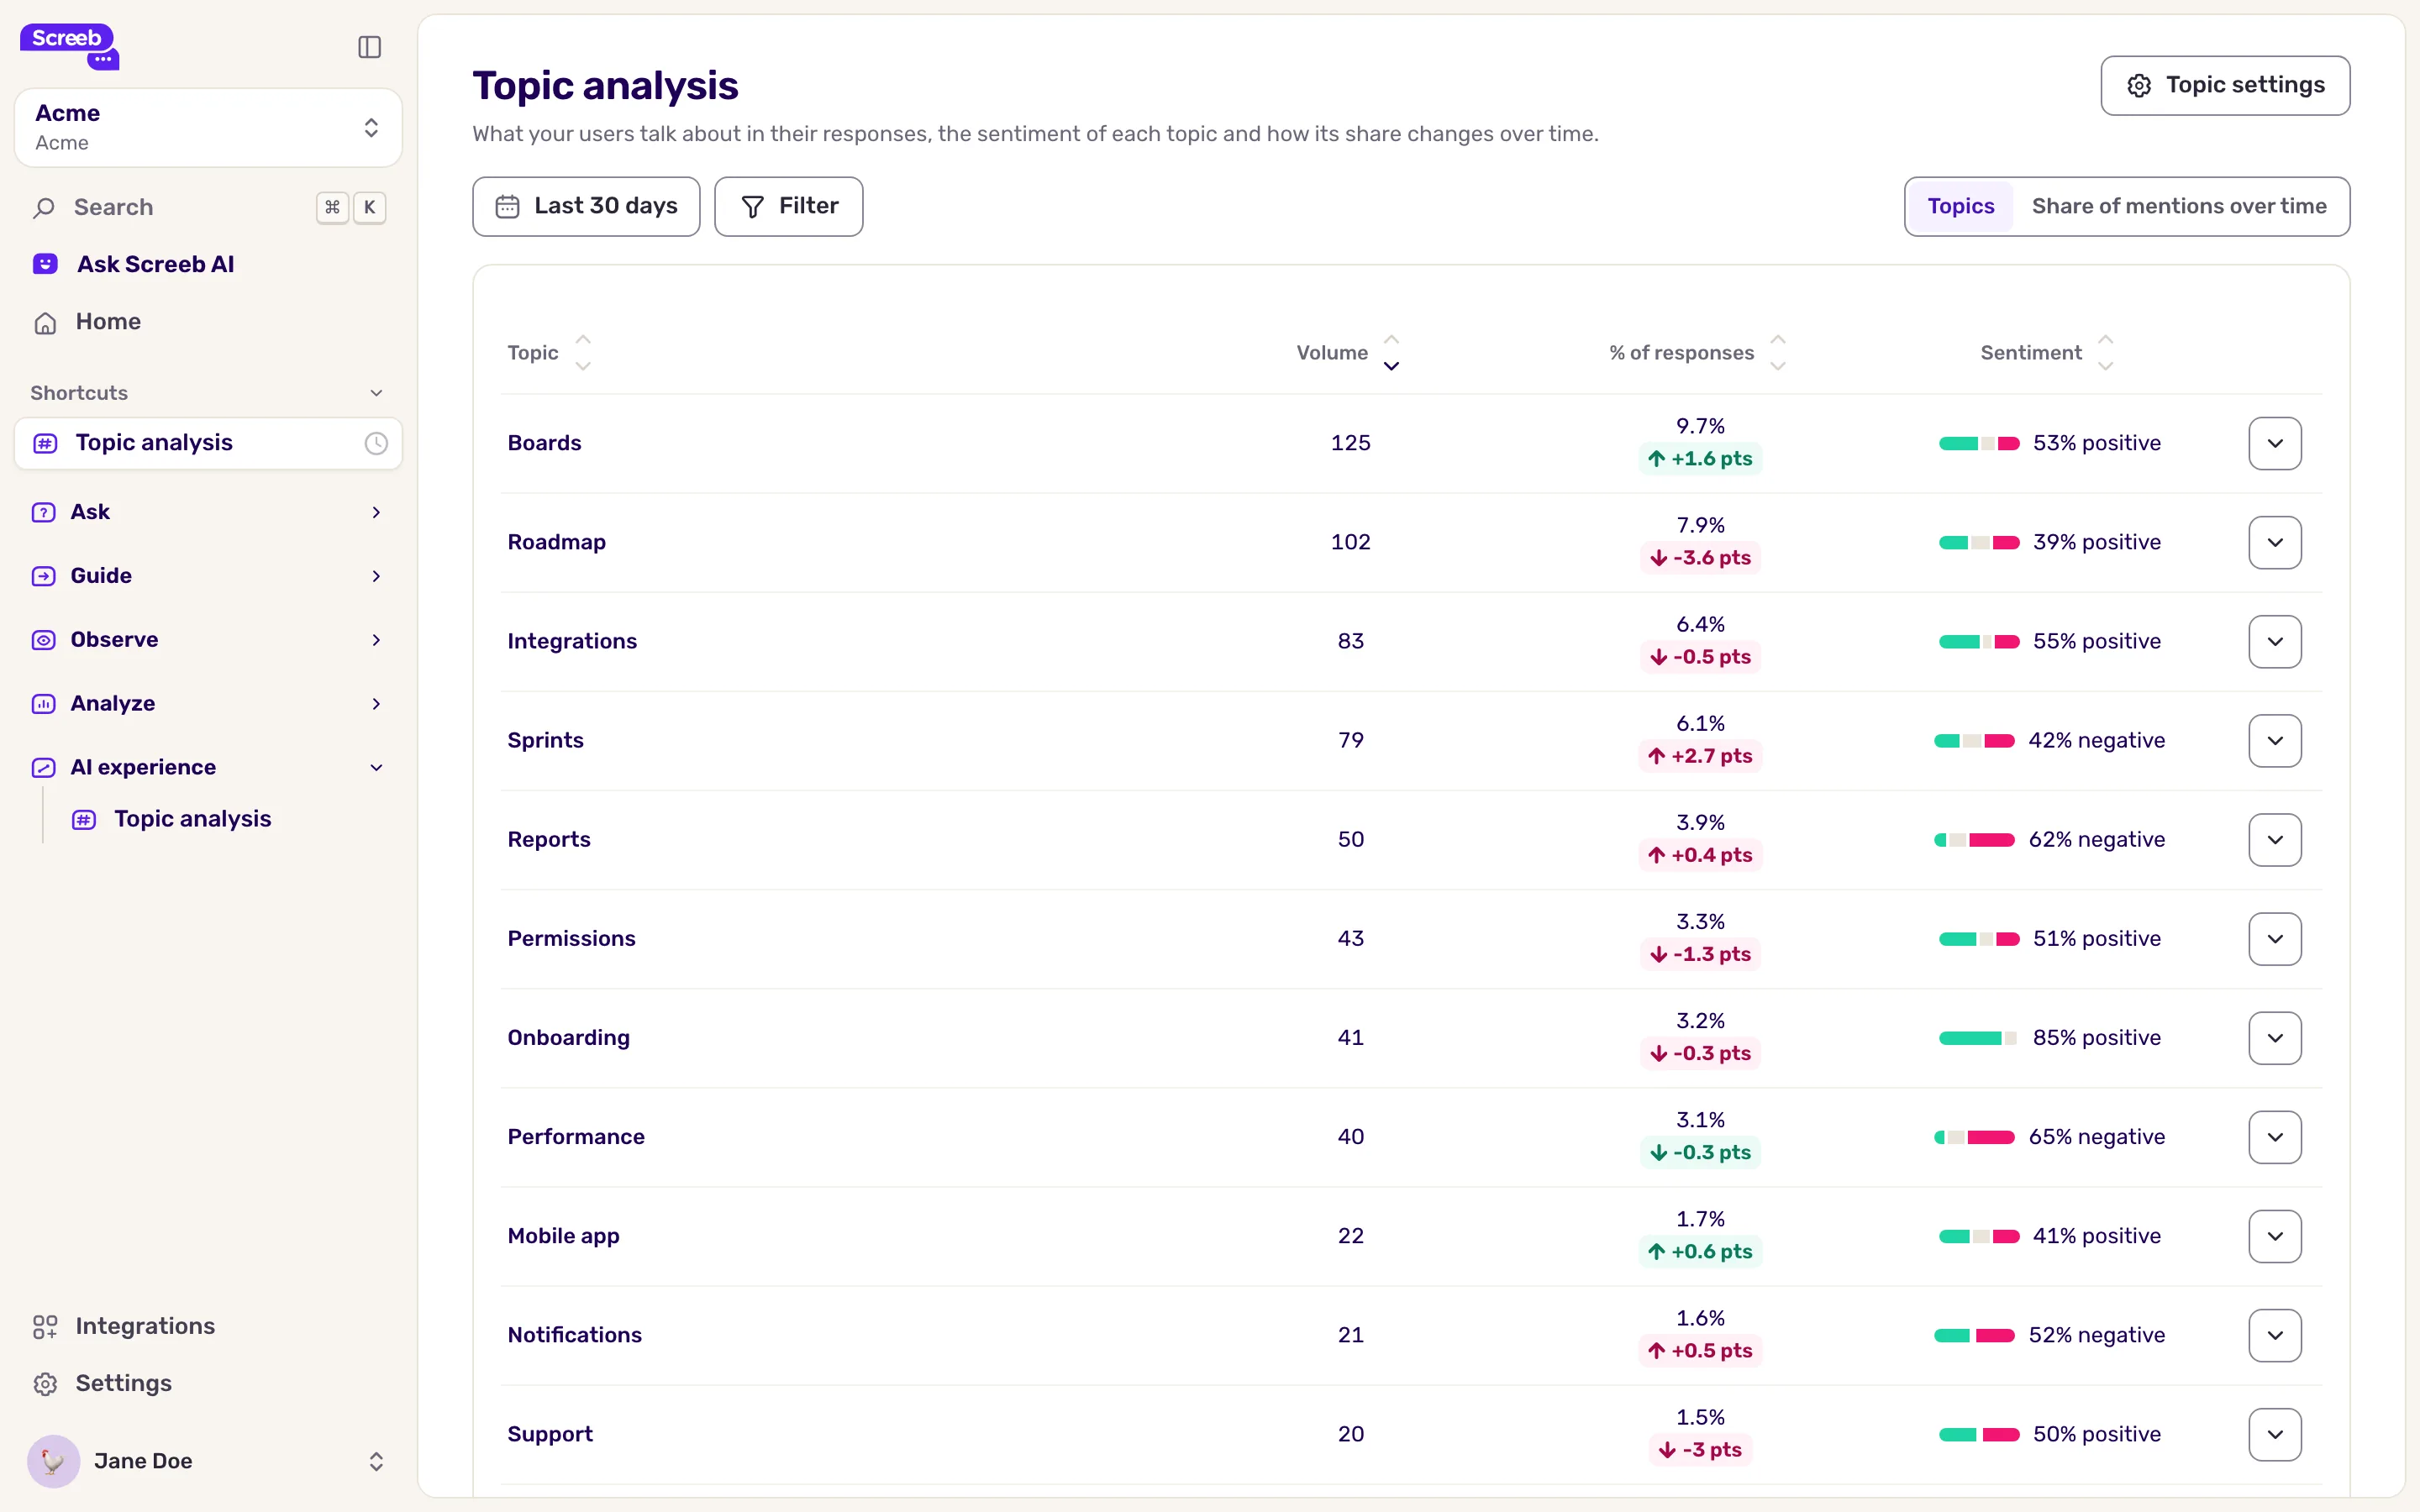
- Click a topic to see its Topic trend: the topic over the period, as a line chart. Click it again to close it.
Read the topics table
Section titled “Read the topics table”| Column | What it means |
|---|---|
| Topic | The tag that names the topic. |
| Volume | The number of responses that mention it over the period. |
| % of responses | The share of the period’s responses that mention it, and its change in points from the previous period. A topic absent before reads “new”. |
| Sentiment | The dominant sentiment with its share, such as “75% negative”, and a bar of positive, other and negative responses. |
A response can mention several topics, so the shares can add up to more than 100%. A growing topic shows in red when it is mostly negative, since more complaints are bad news.
Follow topics over time
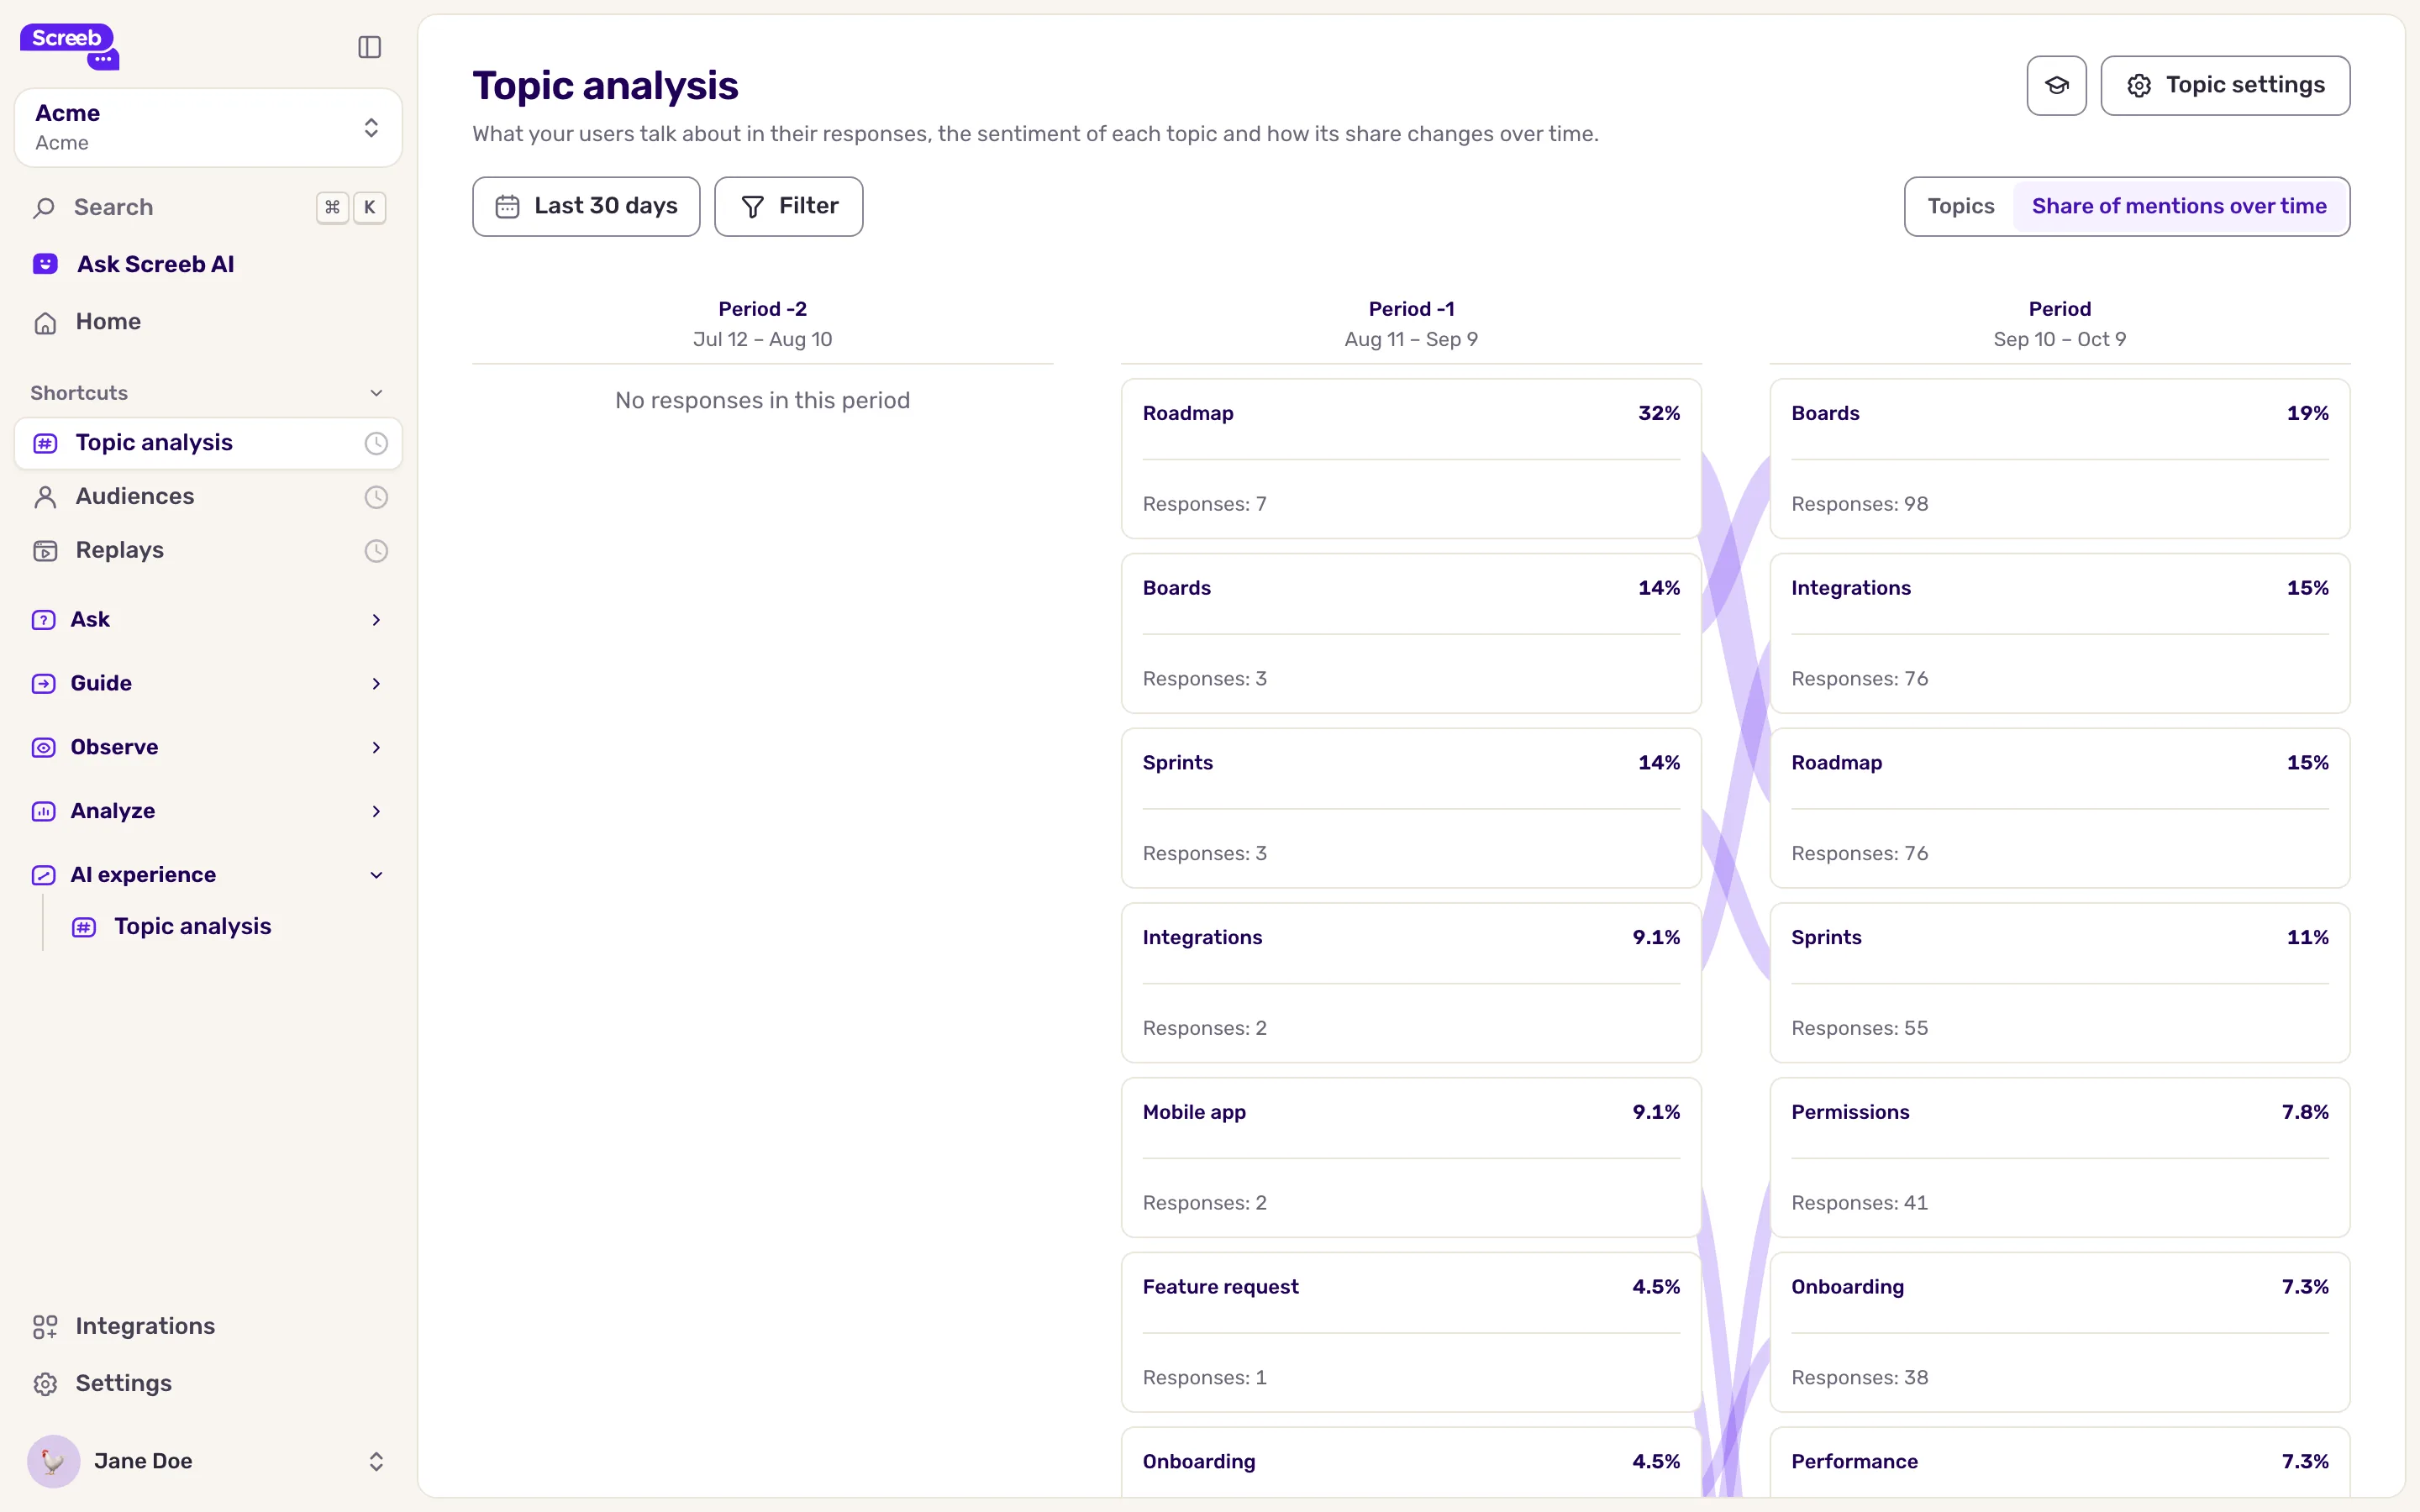
Section titled “Follow topics over time”Click Share of mentions over time at the top of the page. The chart compares the share of each topic from one period to the next, so you see which subjects rise and which fade. The period and filters carry over from one view to the other.
Turn topics into product priorities
Section titled “Turn topics into product priorities”A list of topics is a signal, not a roadmap. To decide what to work on:
- Look at volume and sentiment together. A rare but strongly negative topic can matter more than a frequent neutral one.
- Check who is behind a topic. Add a filter on a user property, such as the plan or the size of the account.
- Follow the trend, not one snapshot. A topic that keeps growing over several periods is a stronger signal than a one-time spike after a release.
- Bring the words of your users. Before a product review, read the responses tagged with the topic and pick a few quotes. See Filter survey responses.
- Check after you ship. Once a fix is live, watch whether the topic’s share goes down in the following periods. If it does not, the root cause may still be there.
What you get
Section titled “What you get”A ranked view of what your users talk about, with the tone and the trend of each topic, ready to back a product decision.
Troubleshooting
Section titled “Troubleshooting”The table is empty. No response of the period carries a tag. Check your tags in Tagging (see Tag responses automatically), or widen the period.
A topic you just created is missing. Tagging past responses can take a while. Come back later.
Go further
Section titled “Go further”- Analyze open-ended answers with AI
- Build workspace and organization reports: add a topics widget to a report.
- Read your survey results