

Compare your scores with your industry
See how your response rate, completion rate, NPS, CSAT, CES and NES rank against other companies of your industry, with an AI analysis of the gaps.
The benchmark puts your survey scores next to those of other companies of your industry, so you know whether a 35 NPS is a reason to worry or to celebrate.
Before you start
Section titled “Before you start”- AI features must be available for your workspace: without them, the page is not in the sidebar.
- Your surveys need responses. The page uses every response since the workspace was created, on all its surveys (messages are left out).
- Your workspace is compared within its industry, shown at the top of the page. Without an industry, it has no companies to be compared with. To set or change it, click Change industry next to it, or go to Settings, then, under Data & deployment, Workspace default settings, pick it under Industry and click Save. Changing the industry needs a role that can edit the organization.
Open the benchmark
Section titled “Open the benchmark”- In the sidebar, under Analyze, click Benchmark.
- Read the badges at the top: your industry with the number of companies you are compared with, and your overall rank, as a top share of the industry.
- Read one card per metric below, then the AI analysis at the bottom.
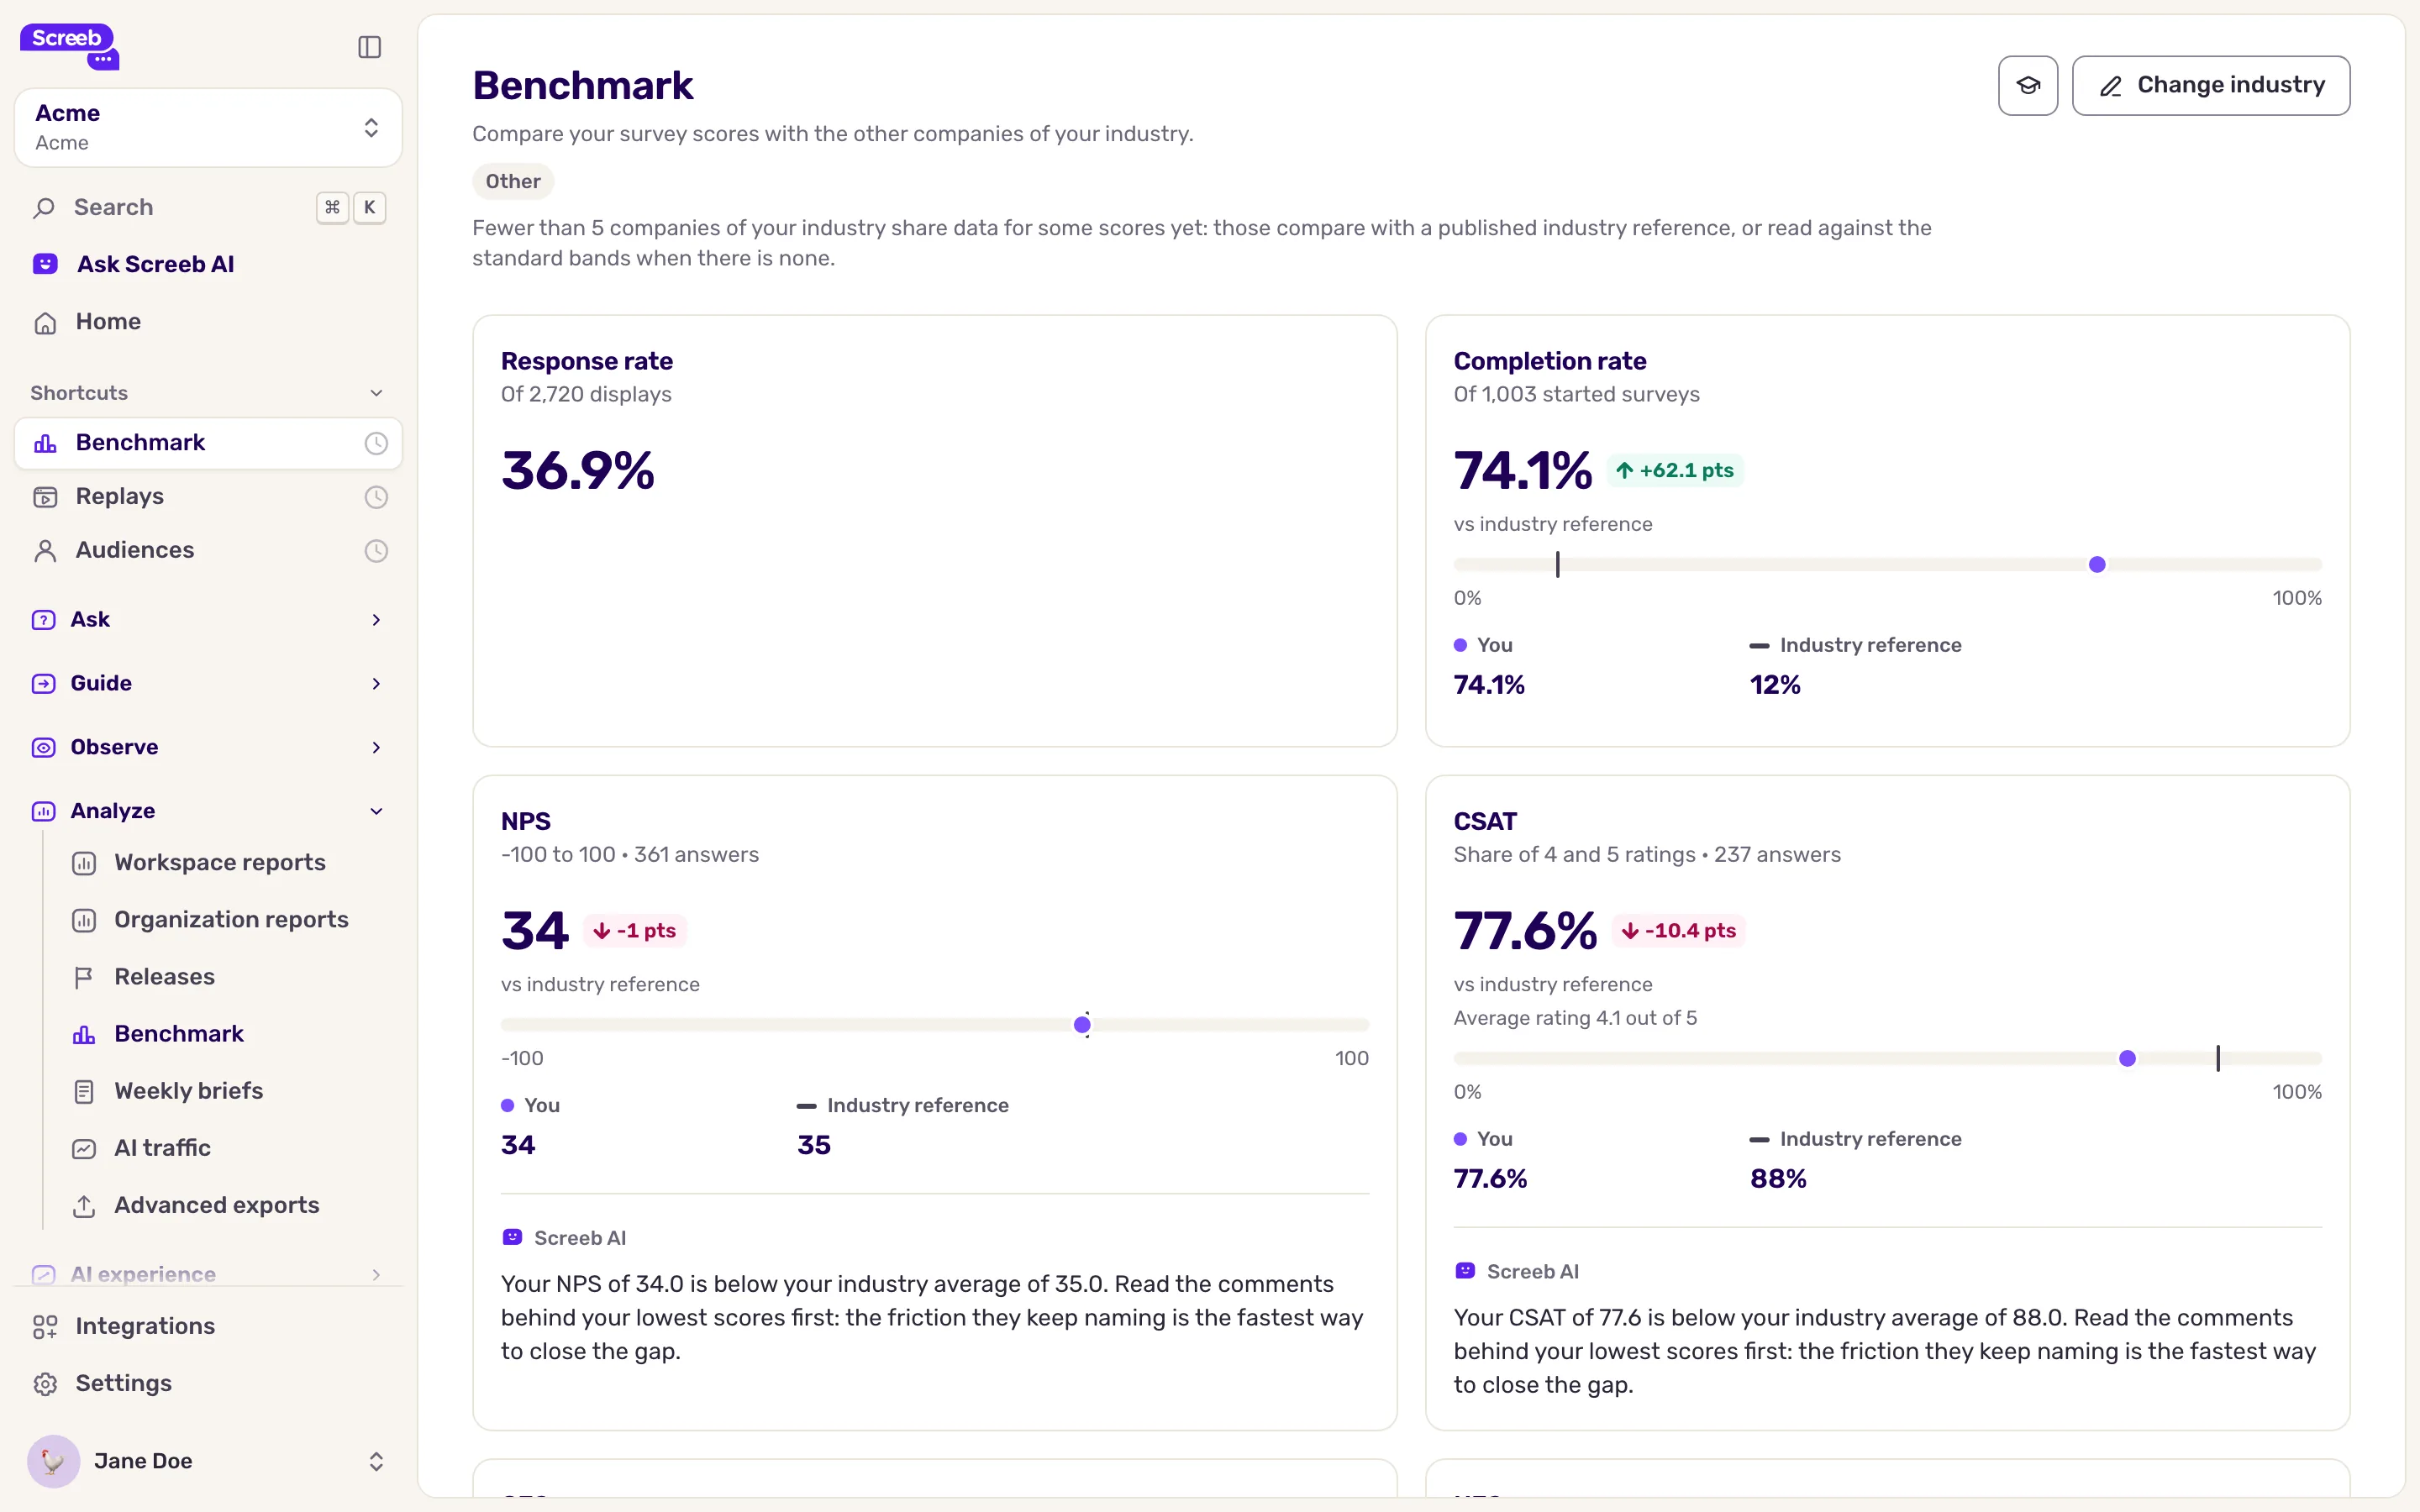
Read a metric card
Section titled “Read a metric card”The page has six cards: Response rate, Completion rate, NPS, CSAT, CES and NES. Under each title, a line gives the scale and the number of displays, started surveys or answers behind the figure.
| Figure | What it means |
|---|---|
| You | Your score. The colored chip next to it gives the gap to the industry median. |
| Industry median | Half of the companies of your industry score above, half below. |
| Top 10% | The score the best 10% of companies reach. For CES, where lower is better, the lowest 10%. |
| Middle 50% of companies | The grey band on the bar: the range where the middle half of the companies sit. |
The CSAT card counts the share of 4 and 5 ratings, and also gives your average rating out of 5.
Under the NPS, CSAT, CES and NES cards, a short AI note comments on your gap to the industry.
When your industry has few companies
Section titled “When your industry has few companies”Screeb compares you with other organizations on a paid plan that have a workspace in your industry and enough scored answers. When fewer than 5 companies of your industry qualify for a metric:
- the card compares you with Industry reference, a published figure for your industry, when there is one;
- otherwise, it rates your score against standard bands: Good, Fair or Poor. Response rate and Completion rate have no bands.
A note at the top of the page tells you when this happens. Your overall rank only counts the metrics compared with real companies.
Use the AI analysis
Section titled “Use the AI analysis”Benchmark analysis, at the bottom of the page, sums up where you stand and suggests what to work on. It takes your company context into account: describe your company in your organization’s AI settings to get more precise advice, see Configure AI settings for your organization.
A score below the median tells you where to look, not why. Open the survey and read the answers of your detractors or unhappy users to find the cause.
What you get
Section titled “What you get”A view of your survey scores against your market, to set realistic goals and to tell good scores from bad ones.
Troubleshooting
Section titled “Troubleshooting”The page says “No scores to compare yet”. Your surveys have no response yet. A card also stays empty when no survey asks that kind of question, such as a CES.
The page shows “Could not load your industry figures”. Click Retry. If the error persists, contact support.
The analysis shows “Could not generate the analysis”. Click Retry to generate it again.