

Track page areas with heatmap zones
Turn an element or an area of a page into a zone, then compare how often it is seen, clicked and hovered.
A zone is a part of a page you want to measure: a pricing card, a banner, a form. Zones tell you how many visitors saw it, clicked it or hesitated on it, and how many converted afterwards, so you can compare the areas of a page side by side.
Before you start
Section titled “Before you start”- Heatmaps work on your workspace, see Analyze pages with heatmaps.
- Creating, renaming and deleting zones needs the permission to edit segments, included in the Editor and Admin roles. Without it, Edit zones is disabled and its tooltip says “Your role can't edit zones. Ask an admin of this workspace.”, and the Zones page hides the rename and delete buttons. You can still view zones and their figures.
- For conversion and revenue, your site sends a conversion event through the Screeb tag, see Measure conversions and revenue by zone.
Create zones
Section titled “Create zones”- Open Heatmaps and click a page’s address.
- Pick a device at the top right, then switch the view to Zones.
- Click Edit zones on the page.
- With Select an element, hover the page and click an element, clicked or not. To cover an area that is not one element, choose Draw a zone and drag a rectangle.
- Type the Zone name and click Create zone. The zone shows on the page with its figure.
- Add more zones the same way, then click Done.
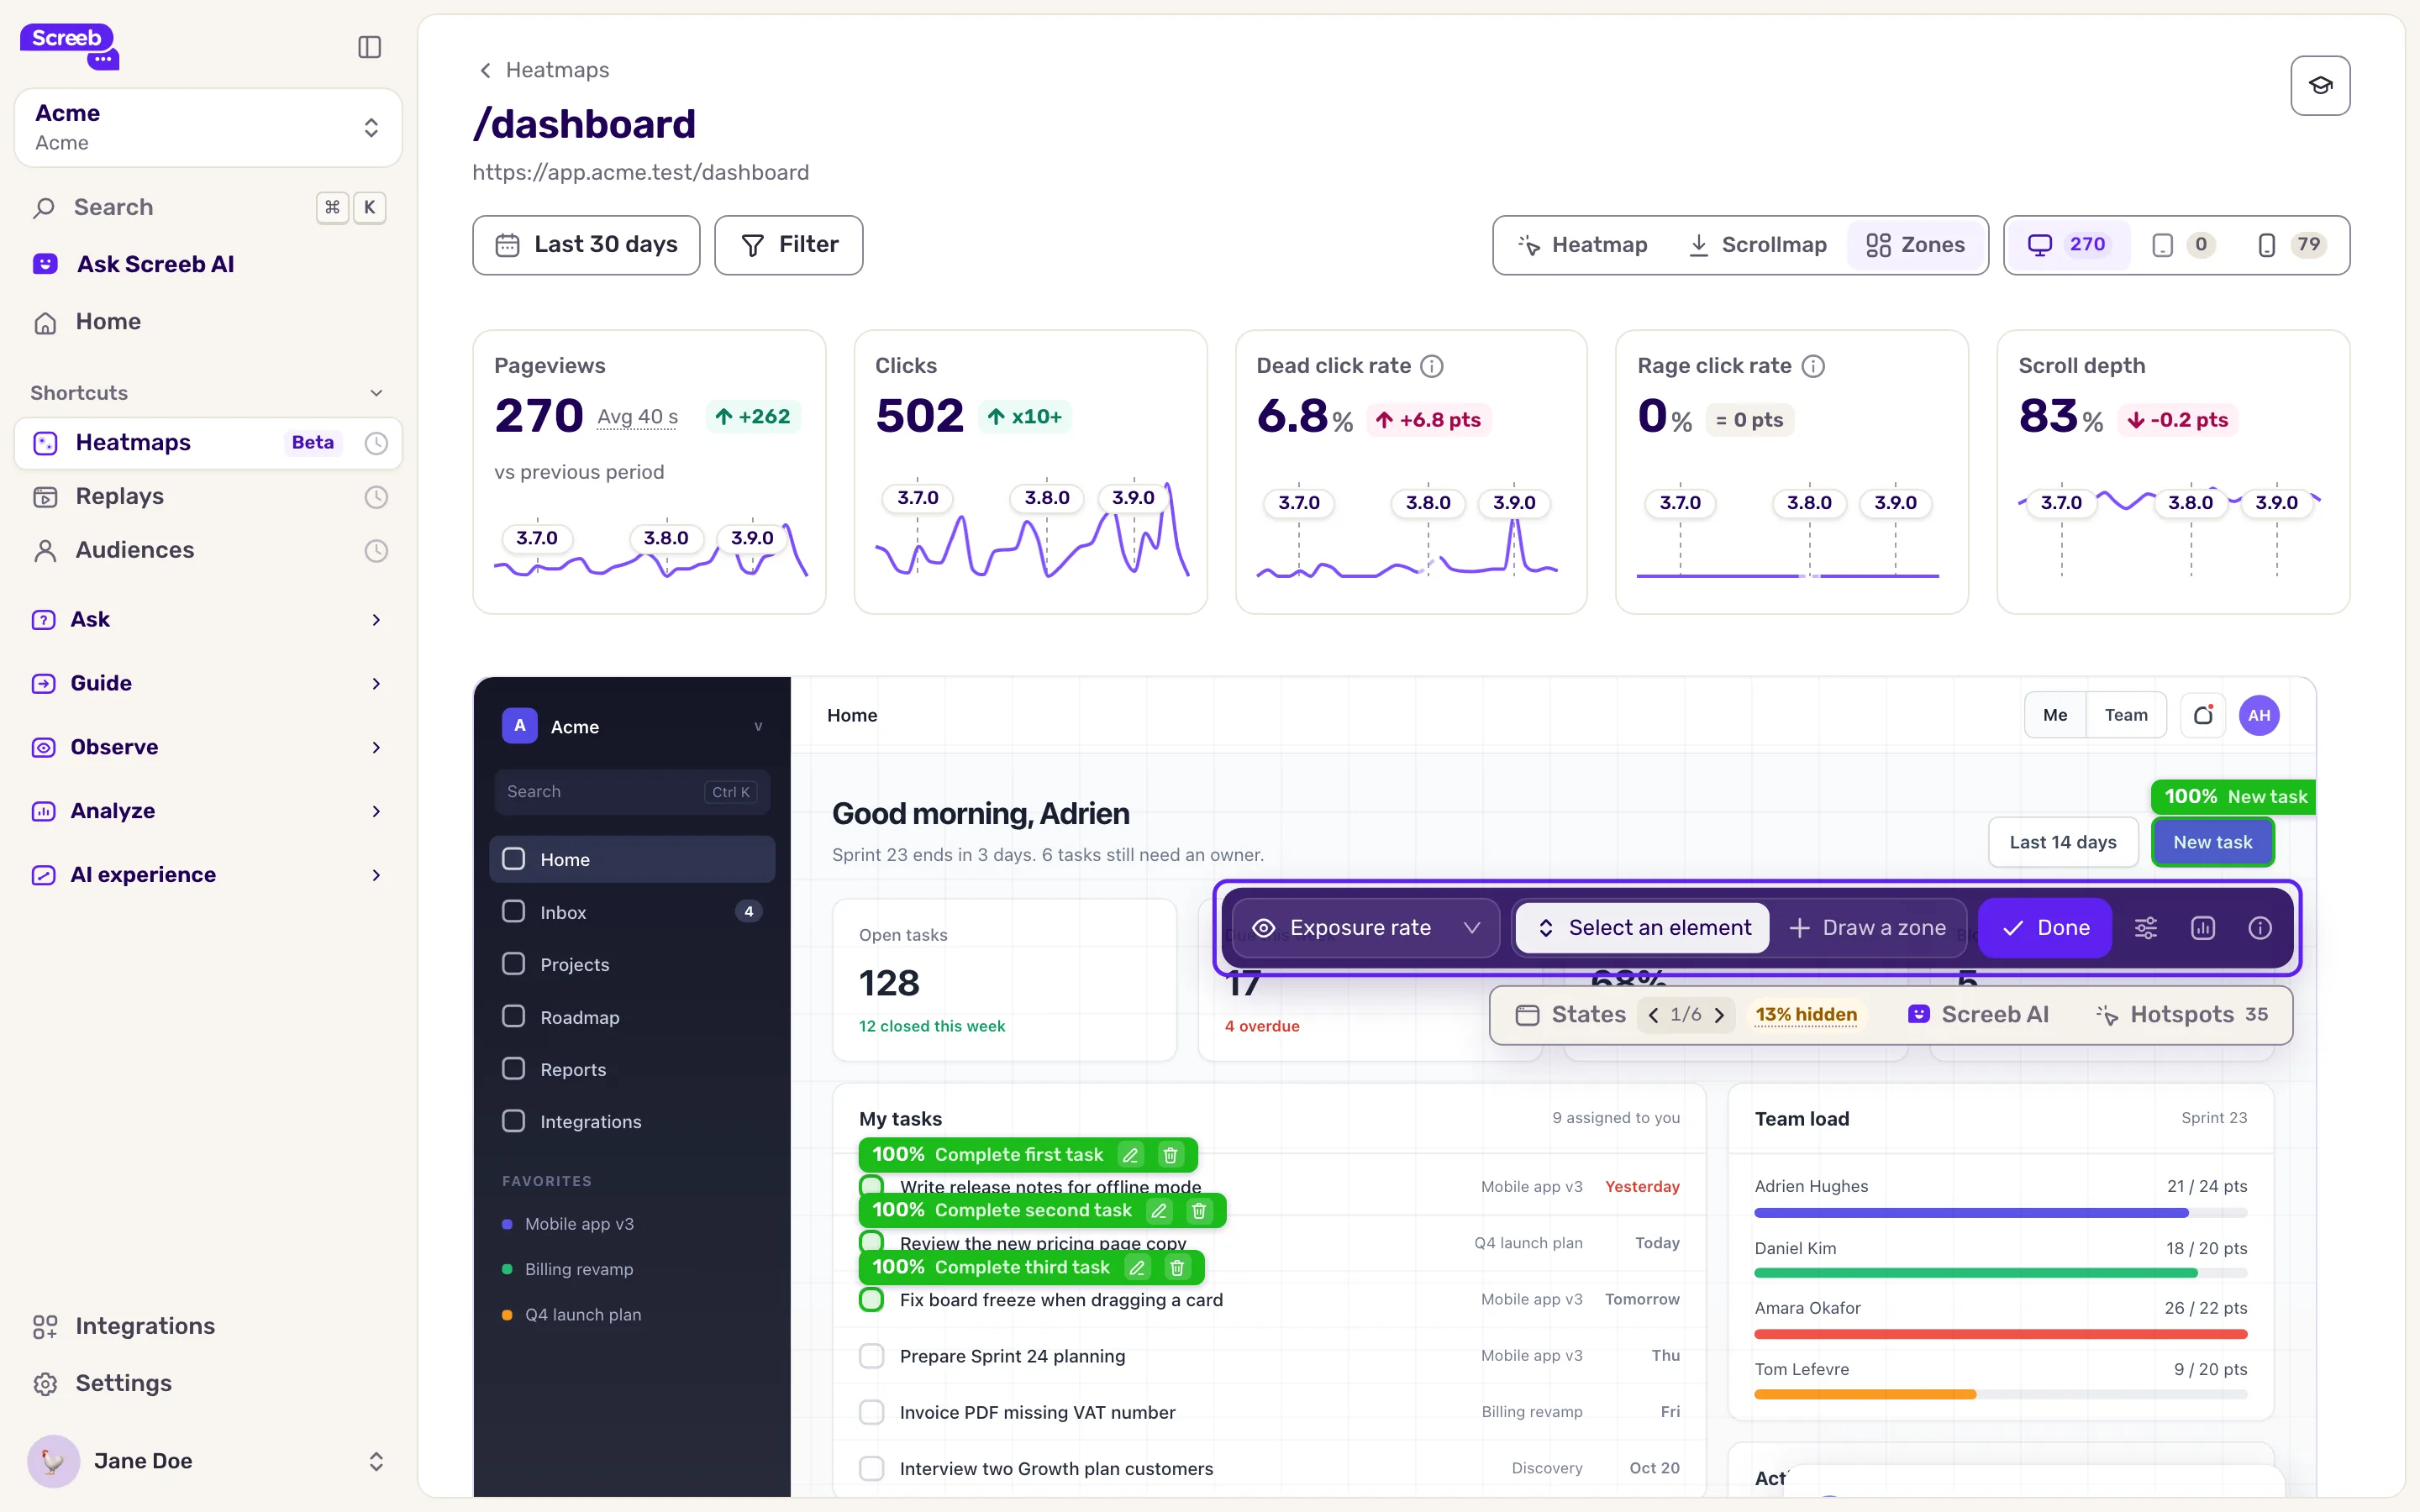
A zone belongs to the device of the replay it was created on: create it again on each device you care about. An element can belong to one zone per device. In edit mode, the buttons on a zone’s label let you Rename it or delete it with Delete zone.
A zone drawn as a rectangle is not bound to an element: its click and hesitation figures carry an Approximate badge, as they are estimated from where clicks land. Prefer selecting the element when there is one.
Read the metrics
Section titled “Read the metrics”Pick the metric shown on the zones with the list in the zones toolbar. Click a zone, outside edit mode, for its details.
| Metric | What it measures |
|---|---|
| Exposure rate | The share of sessions that scrolled the zone into view. |
| Click rate | Of the sessions that saw the zone, the share that clicked it. |
| Exposure time | How long the zone stayed on screen, on average. |
| Hesitation | Of the sessions that saw the zone, the share that hovered it without clicking. |
| Conversion | Of the sessions that saw the zone, the share that then sent your conversion event. |
| Revenue | The revenue carried by the conversion events of the sessions that saw the zone. |
Conversion and revenue depend on a conversion event, see Measure conversions and revenue by zone.
Every metric counts the sessions that clicked or scrolled on the page. A visitor who only looked at the page, without any interaction, is not counted.
Compare all zones
Section titled “Compare all zones”In the zones toolbar, click the Compare all zones button. The Zones page lists every zone of the page, for all devices, with all their metrics. Sort it with Metric, and rename or delete zones from their row.
The figures keep the device, filters and period of the heatmap you came from. The back link at the top returns to that heatmap with the same filters.
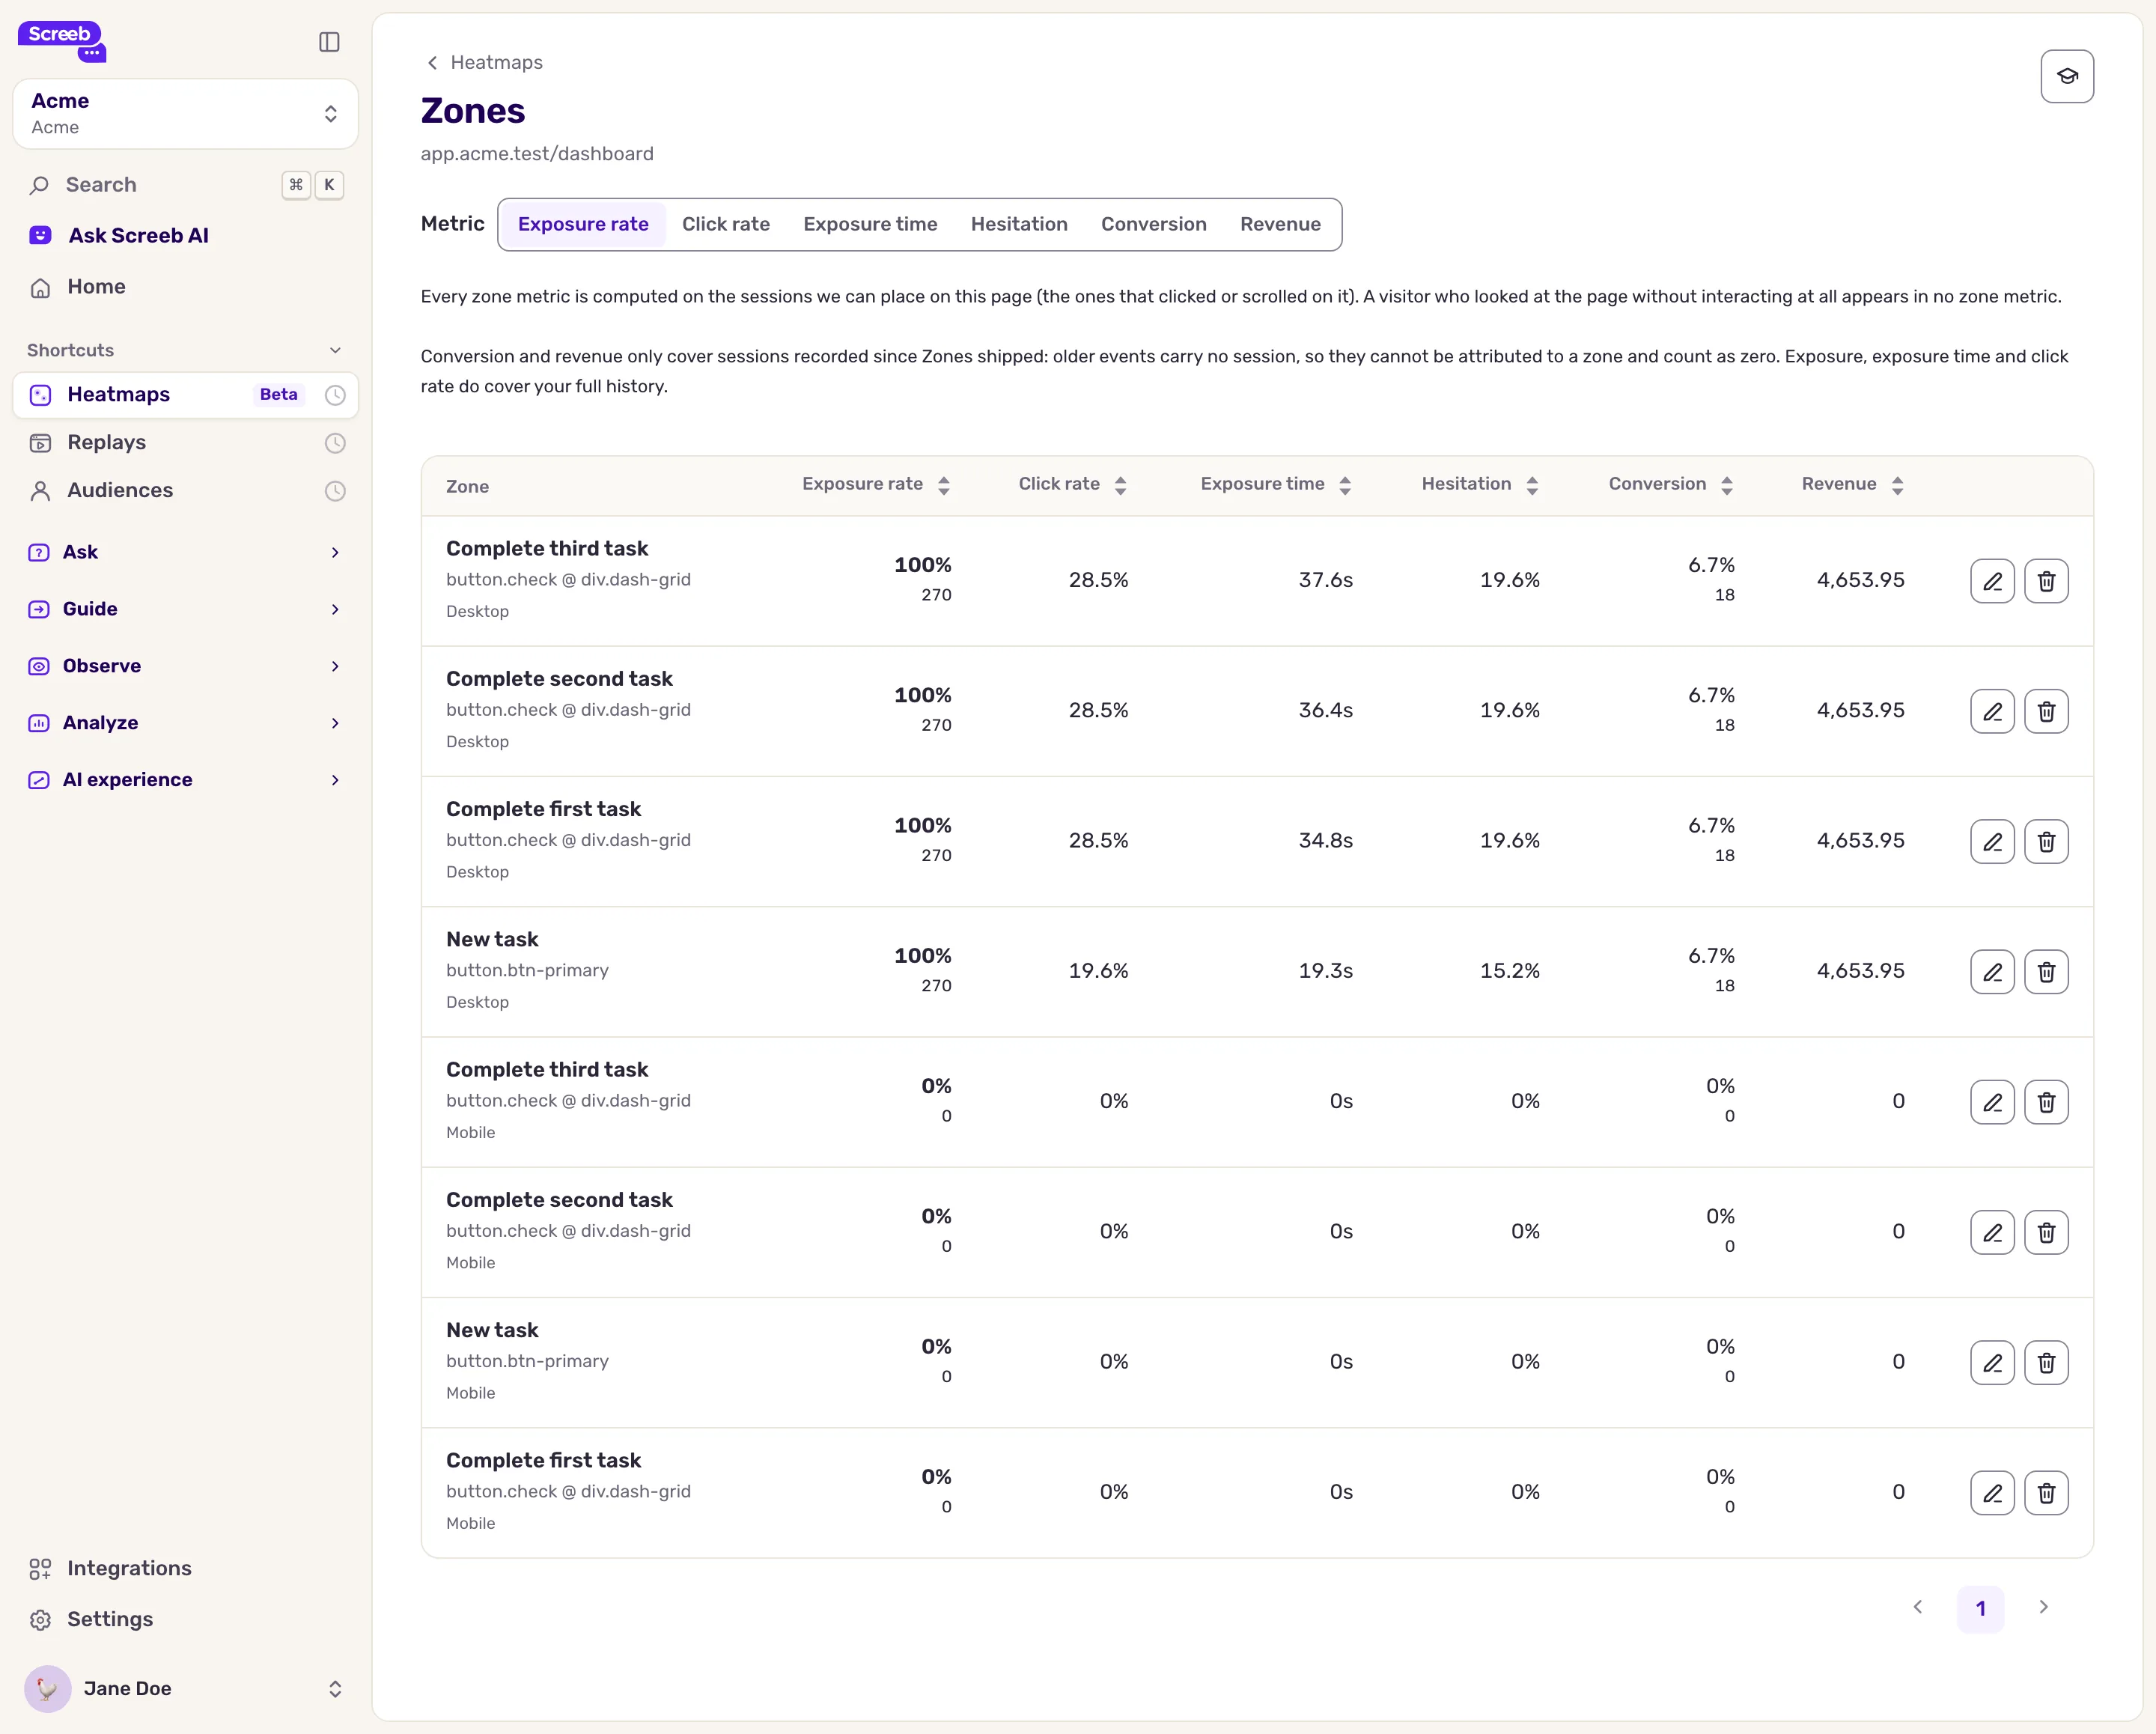
What you get
Section titled “What you get”For each page, figures per area instead of per click, to see which parts of the page get attention and which lead to conversions.
Troubleshooting
Section titled “Troubleshooting”“No zones defined for this page yet” Create the zones from the heatmap first, as described above.
Creating a zone fails because the device is unknown. Pick a device at the top right, then create the zone again.
An element cannot be selected. It may already belong to a zone on this device, or Screeb could not identify it in the replay. Draw a rectangle around it instead.