

Debug your setup with Screeb Inspector
Open Screeb Inspector on your website to check the installation, see why a survey or message shows or not, and test targeting.
Screeb Inspector is a panel that opens on top of your website. It shows whether Screeb is installed correctly, why each survey or message is displayed or not, and what data Screeb receives, without opening the browser console.
Before you start
Section titled “Before you start”- The Screeb tag is installed on your website. The inspector works on websites and mobile websites, not inside native mobile apps.
- Your workspace has a website channel, and your role lets you see surveys.
Open the inspector
Section titled “Open the inspector”- In the admin, click your name at the bottom of the sidebar to open the account menu.
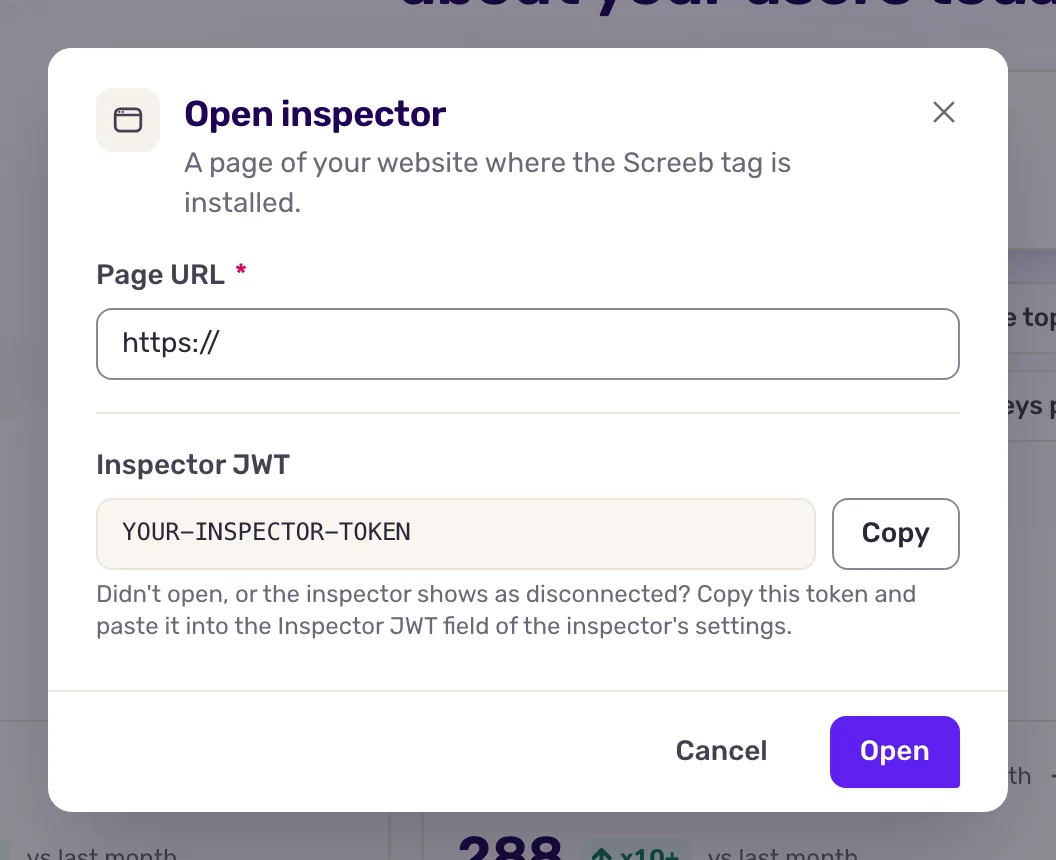
- Click Open inspector.
- In Page URL, enter the address of a page where the tag is installed, or pick one under Your recently used pages.
- Click Open. The page opens in a new tab with the inspector panel already open and signed in to your workspace.
The panel opens at the bottom right of the page. Drag its title bar to move it and its corner to resize it. On a phone, it opens as a drawer at the bottom of the screen.
To use the inspector on a page without going through the admin, add ?screeb-inspector=1 or #screeb-inspector to the page address. A Screeb Inspector button appears at the bottom right of the page: click it to open the panel. In the inspector’s Settings tab, turn on “Auto-open on this domain” to keep it available on that site in your browser.
Signed in or anonymous
Section titled “Signed in or anonymous”Opened from the admin, the inspector is signed in: it shows the real names of your surveys and messages, and the events and properties Screeb stores for the user, including those from integrations. Opened another way, it is anonymous: surveys and messages show by ID, and only the data known to the page is visible.
To sign in, copy the token from Inspector JWT with Copy, paste it in the Authentication section of the inspector’s Settings tab and click “Sign in”. The token is valid for 24 hours and only for this workspace.
Read the tabs
Section titled “Read the tabs”Start with Overview, then go to the tab that matches your question.
- Overview: the visitor, the environment (page, device, locale, SDK version), a summary of surveys and messages, and the Session Replay status. The “Installation & Health” checklist tests the installation, the connection to Screeb, the Content Security Policy (stylesheet, fonts, media), the user identity, the quota, the targeting engine and the session. Click “Re-run checks” after a fix.
- Surveys and Messages: each item with its status. “running” is on screen, “eligible” matches its rules but is not shown yet, “excluded” fails at least one rule, and for a started message “not displayed” means its display conditions are not met yet. Open an item to see its rule tree and which rule passes or fails.
- Simulate: change the URL, platform, locale, app version, mobile screen, time or session start, and add events or properties. “Run simulation” shows which rules would pass. “Start live simulation” lets matching surveys and messages appear for real, as previews that use no quota and record no data. Save scenarios to reuse them.
- Events: the events the visitor sent, with search and filters. Open one to see its properties.
- Properties: the visitor’s properties, with their type, value and source.
- Settings: authentication, auto-open, the Screeb data stored in the browser (copy it as JSON for support), a Danger zone to clear it, and the tag version.
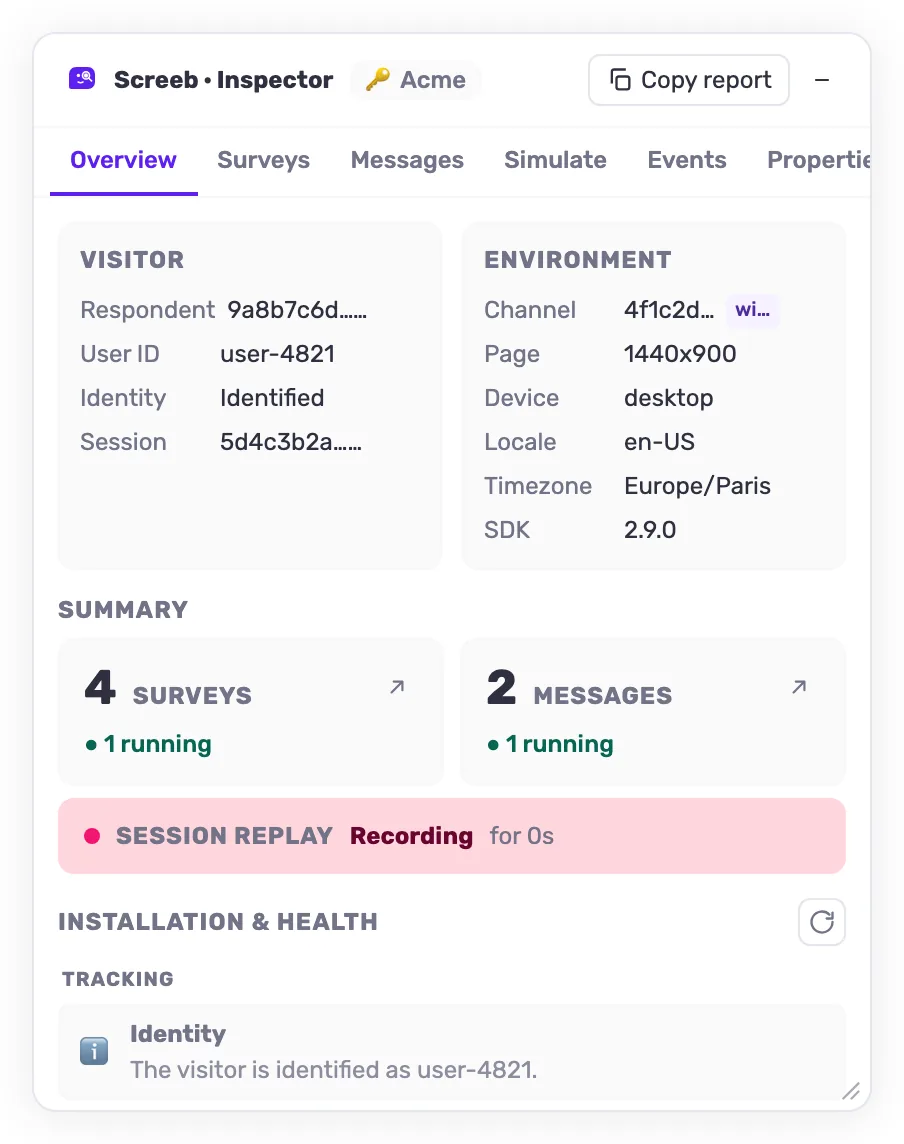
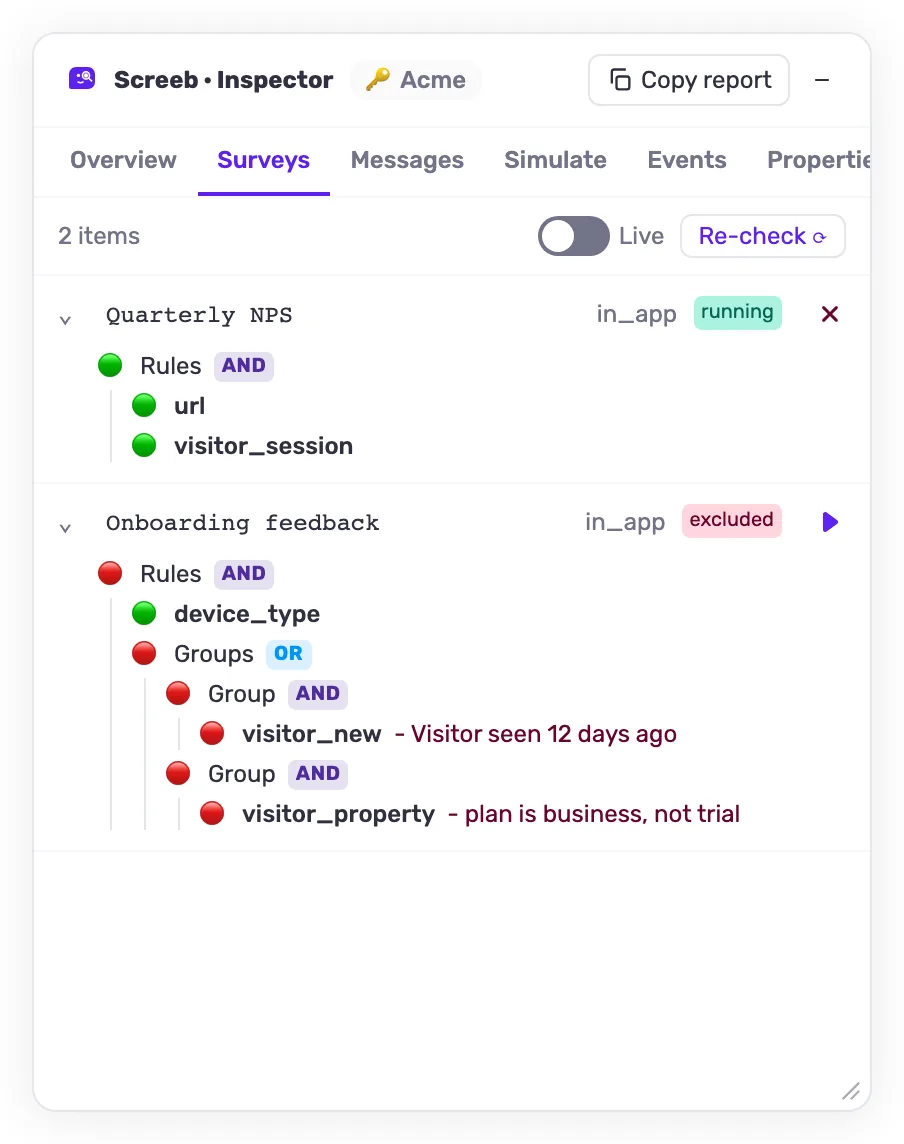
The inspector’s own interface is in English.
What you get
Section titled “What you get”You see in one place whether the problem comes from the installation, from the data Screeb receives, or from a targeting rule, and which rule to change.
Troubleshooting
Section titled “Troubleshooting”The admin shows “No website channel found for this workspace.”. The workspace has no website channel. Install the tag on your website first from Install Screeb.
The page opened but the inspector did not, or shows as disconnected. Check that the tag loads on that page. Then copy the token from the admin window and paste it in the inspector’s Settings tab.
An item is excluded and you do not know why. Open it in the Surveys or Messages tab: the failing rule is marked in its rule tree. To change the rule, see Choose who sees your survey.